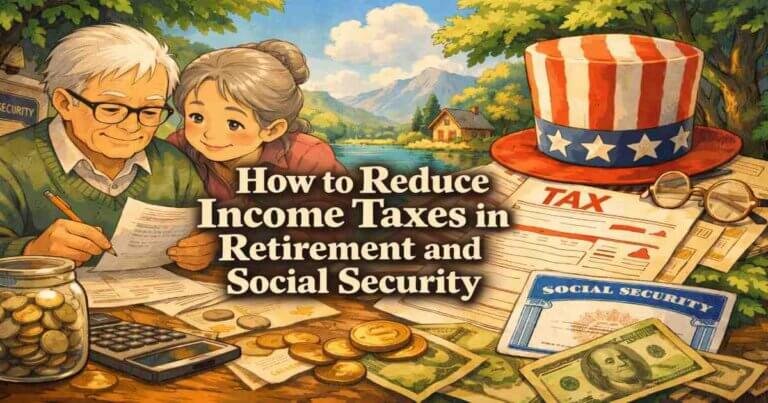
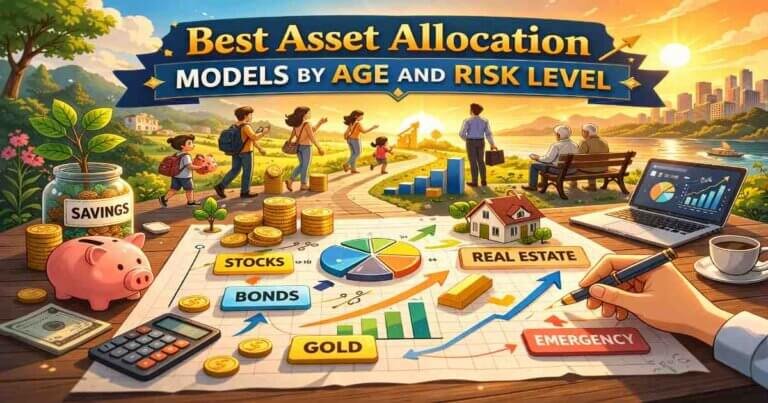
Introduction
I remember the first time I tried to pick an ETF to invest in. I opened my brokerage account, searched “ETFs,” and was immediately hit with thousands of options. Technology ETFs, dividend ETFs, international ETFs, bond ETFs, leveraged ETFs, inverse ETFs—the list went on forever.
I felt completely overwhelmed. Which one was “best”? Which one was safest? How was I supposed to know the difference between all these funds that seemed to do similar things? I spent weeks researching, reading reviews, comparing expense ratios, and still felt paralyzed by indecision.
Here’s what I wish someone had told me back then: you don’t need dozens of ETFs. You don’t need complex strategies. You need 2-3 simple, low-cost, broad-market ETFs—and that’s it.
Maybe that’s where you are right now. You know you should be investing. You’ve heard that ETFs are a good way to start. But when you actually try to choose one, you’re paralyzed by the sheer number of options and the fear of making the wrong choice. If you’re searching for the best ETFs for beginners, this guide walks through simple, low-risk options designed for new investors.
This guide is written for complete beginners who want a clear, honest answer to a simple question: “Which ETFs should I actually buy?”
I’m not going to show you 50 options and make you figure it out. I’m going to show you the 8 core ETFs that are genuinely best for beginners, explain exactly why they’re the safest picks, show you how to combine them into simple portfolios, and give you the confidence to start investing today.
By the end of this guide, you’ll know exactly which ETFs to buy, how much to put in each, and why these picks are safer and better than the thousands of other options out there.
Plain-English Summary
Let me tell you what we’re going to cover.
First, I’ll explain what ETFs actually are in simple terms—because if you don’t understand the basics, you can’t make good decisions. Then I’ll explain why ETFs are better than individual stocks and mutual funds, and what makes a specific ETF “safe” versus risky for beginners.
From there, I’ll show you my top 8 core ETF recommendations—these are the safest, simplest, most reliable picks for beginners. For each one, I’ll explain what it holds, why it’s excellent, what the costs are, and who should buy it. These aren’t trendy picks or complex strategies—they’re the boring, proven funds that have built wealth for millions of investors.
I’ll also cover how to combine ETFs into simple portfolios, how to avoid the dangerous ETF traps that hurt beginners, and how to tell which ETFs to avoid completely. You’ll learn about expense ratios, tracking error, liquidity, and the other key factors that separate great ETFs from mediocre ones.
Most importantly, I’ll show you ready-to-use portfolio combinations based on your age and situation—so you can start investing today with confidence. These portfolios follow the FinanceSwami Ironclad Investment Strategy Framework, which emphasizes maintaining 85-100% stocks across all ages, shifting within stocks from growth to dividend focus as you age, and keeping portfolios simple with 2-5 core holdings.
This isn’t about building the “perfect” portfolio. This is about building a simple, safe, effective portfolio that will grow your wealth over decades without requiring constant attention or expertise.
Let’s eliminate the confusion and get you invested.
Table of Contents
1. What Is an ETF? (Simple Explanation)
Let me explain ETFs in the simplest way possible.
ETF stands for Exchange-Traded Fund. It’s a basket of investments (usually stocks or bonds) that you can buy and sell like a single stock.
Think of it this way: instead of buying shares of one company (like Apple), you buy shares of a fund that owns hundreds or thousands of companies. You get instant diversification in one purchase.
A Simple Example
Let’s say you want to own pieces of the 500 largest U.S. companies. You could:
Option A: Buy shares of all 500 companies individually
- Requires hundreds of thousands of dollars
- Need to make 500 separate transactions
- Have to research each company
- Pay commissions on 500 trades
- Manually rebalance as companies grow or shrink
Option B: Buy one ETF that owns all 500 companies
- Costs as little as $50-100 for one share
- One simple transaction
- Zero research required
- One commission (or none with most brokerages)
- Automatic rebalancing built in
That’s the power of ETFs—instant diversification in a single purchase.
How ETFs Work
When you buy one share of an ETF:
- A fund company (Vanguard, Fidelity, BlackRock, Schwab) owns the actual stocks or bonds
- Your ETF share represents partial ownership of everything the fund holds
- The price of your ETF moves based on the combined value of everything it owns
- You can buy or sell shares during market hours (9:30 AM – 4:00 PM Eastern), just like a stock
Example: You buy one share of VOO (Vanguard S&P 500 ETF) for $450. That one share gives you fractional ownership of Apple, Microsoft, Amazon, Google, Tesla, and 495 other major companies. If the combined value of those 500 companies goes up 10%, your VOO share goes up 10%.
ETF vs. Mutual Fund vs. Individual Stocks
Comparison Table:
| Feature | Individual Stocks | Mutual Funds | ETFs |
| Diversification | None (single company) | High (100-1000+ holdings) | High (100-1000+ holdings) |
| Minimum investment | Price of 1 share ($50-$500+) | Often $1,000-$3,000 | Price of 1 share ($50-$500) |
| Trading | Anytime during market hours | Once per day after close | Anytime during market hours |
| Expense ratio | None (but research time) | 0.50%-2.00% typical | 0.03%-0.20% typical |
| Tax efficiency | Good (control timing) | Poor (forced distributions) | Good (tax-efficient structure) |
| Research required | High (hours per company) | Moderate | Minimal (follow index) |
| Best for beginners | No | Sometimes | Yes |
According to research by Morningstar analyzing cost and performance data, ETFs typically outperform equivalent mutual funds by 0.3-0.7% annually due to lower fees and better tax efficiency.
What ETFs Hold
ETFs can hold almost anything, but the safest ones for beginners hold:
Stock ETFs:
- Broad market: Total U.S. stock market, S&P 500, total world stocks
- Growth-focused: Nasdaq-100, technology sector
- Dividend-focused: High dividend yield, dividend growth
- International: Foreign developed markets, emerging markets (optional for diversification)
Bond ETFs:
- Government bonds: U.S. Treasury bonds
- Corporate bonds: Investment-grade corporate debt
- Total bond market: Diversified bond holdings
According to the FinanceSwami Ironclad Investment Strategy Framework, beginners should focus exclusively on:
- Broad market stock ETFs (VOO, VTI, QQQM) – 85-100% of portfolio
- Dividend-focused ETFs (SCHD, VYM, JEPI) – Increasing allocation with age
- Total bond market ETFs (BND) – 0-15% maximum, only after age 55
Avoid sector-specific, leveraged, inverse, or complex strategies.
The Key Numbers You Need to Know
Every ETF has a few important details you should understand:
1. Ticker Symbol
The letters used to identify it when buying/selling:
- VOO = Vanguard S&P 500 ETF
- VTI = Vanguard Total Stock Market ETF
- QQQM = Invesco Nasdaq-100 ETF
2. Expense Ratio
The annual fee as a percentage of your investment:
- 0.03% = $3 per year on $10,000 invested
- 0.50% = $50 per year on $10,000 invested
- Lower is always better
Over 30 years, the difference compounds dramatically:
| Expense Ratio | $10,000 Invested | Annual Fee | Cost Over 30 Years |
| 0.03% (VOO) | Growing at 10% | $3-$17/year | ~$1,000 total |
| 0.50% (average) | Growing at 9.5% | $50-$300/year | ~$18,000 total |
| 1.00% (expensive) | Growing at 9.0% | $100-$650/year | ~$37,000 total |
That 1% difference costs $36,000 over 30 years on just $10,000 invested.
3. Assets Under Management (AUM)
Total money in the fund:
- Larger is generally safer (more liquidity, less likely to close)
- Minimum: Prefer ETFs with $500M+ in assets
- Ideal: $1B+ in assets
4. Holdings
Number of companies or bonds in the ETF:
- More holdings = more diversification = lower risk
- S&P 500 ETF: 500 companies
- Total market ETF: 3,000+ companies
- Sector ETF: 50-100 companies (more concentrated, riskier)
Real Example: VOO (Vanguard S&P 500 ETF)
Let me break down what all these numbers mean in practice:
- Ticker: VOO
- Expense Ratio: 0.03% ($3 per year on $10,000)
- AUM: $450+ billion (extremely safe, massive liquidity)
- Holdings: 500 large U.S. companies
- Share price: ~$450 (as of 2026)
- Dividend yield: ~1.5% annually
What this means: You pay $3 annually per $10,000 invested to own pieces of the 500 largest U.S. companies (Apple, Microsoft, Amazon, Google, Berkshire Hathaway, Tesla, and 494 others). The fund automatically rebalances, removing failing companies and adding growing ones. You do nothing except hold.
That’s it. That’s what an ETF is. It’s a simple, low-cost way to own hundreds or thousands of investments in a single purchase. No complexity. No fancy strategies. Just broad diversification at rock-bottom cost.
2. Understanding How ETFs Are Traded on the Stock Market
One thing that confuses beginners is how ETFs actually work in practice. Let me explain this clearly, because understanding this helps you feel confident when you’re ready to invest.
ETFs are traded on the stock market just like individual stocks. When you decide to buy an etf through your online broker, you’re purchasing shares that trade throughout the day during market hours—9:30 AM to 4:00 PM Eastern time. This is fundamentally different from mutual funds, which only trade once per day after the market closes
Here’s what this means for you practically: if you want to invest in ETFs today, you can place your order and it executes within seconds during market hours. The price you see is the price you get (assuming you use a market order). You can buy or sell etfs anytime the market is open, giving you flexibility that mutual funds simply don’t offer.
The beauty of this system is that etfs allow you to invest your money in thousands of companies through a single transaction. When you buy one share of VOO, for example, you’re getting exposure to all 500 companies in the S&P 500 index. The ETF does the work of buying, holding, and rebalancing those 500 stocks—you just own one simple investment that represents all of them.
This is why ETFs are often called “exchange-traded funds”—they trade on exchanges like the New York Stock Exchange or Nasdaq, just like regular stocks. But instead of owning one company, you own a fund that holds hundreds or thousands of different investments.
Why Online Brokers Have Made ETF Investing Accessible
Twenty years ago, investing required calling a broker, paying hefty commissions, and dealing with minimums that kept most people out of the market. Today, the barriers have completely disappeared.
Every major online broker now offers commission-free ETF trading. Fidelity, Vanguard, Schwab, and other reputable platforms let you buy and sell an etf without paying trading fees. This means your entire investment goes to work immediately—nothing gets eaten up by transaction costs.
When you want to invest through one of these platforms, the process takes about 20 minutes to open an account. You provide basic information, link your bank account, transfer money, and you’re ready to start investing in etfs. The technology has made what used to be complicated remarkably simple.
I mention this because many beginners think you need thousands of dollars or special knowledge to work with an online broker. You don’t. You can open an account with as little as $1 at most platforms, and the interface guides you through every step. If you’ve ever made an online purchase, you can buy your first ETF.
The democratization of investing through low-cost online brokers is one of the most positive financial developments of the last two decades. It means anyone interested in investing can start building wealth through ETFs, regardless of how much money they’re starting with.
3. Why ETFs Are Perfect for Beginners Starting Out
Let me explain why ETFs are the ideal starting point for beginner investors—and why they often beat the strategies used by professionals.
Reason #1: Instant Diversification
When you buy a single share of a broad market ETF, you instantly own pieces of hundreds or thousands of companies across different industries, sizes, and business models.
According to modern portfolio theory and research by Harry Markowitz (Nobel Prize winner for portfolio diversification), owning 30+ stocks from different sectors reduces company-specific risk by approximately 90% compared to owning a single stock.
Example of diversification protection:
| Scenario | If You Own Only Apple Stock | If You Own S&P 500 ETF (500 Companies) |
| Apple has bad quarter | Your portfolio drops 20-30% | Your portfolio drops 0.5-1% (Apple is ~6% of index) |
| Tech sector crashes | Your portfolio crashes | Your portfolio drops 15-20% (tech is ~30% of index) |
| Apple goes bankrupt | You lose 100% | You lose 6% (other 494 companies continue) |
Diversification doesn’t eliminate risk, but it dramatically reduces the impact of any single company’s problems. No individual stock can destroy your portfolio when you own 500 of them.
Reason #2: Extremely Low Costs
According to data from Morningstar’s 2024 fee study, the average expense ratio by investment type:
Annual Expense Ratios:
| Investment Type | Average Expense Ratio | Cost on $10,000 | Cost on $100,000 |
| Index ETFs | 0.05% | $5/year | $50/year |
| Active ETFs | 0.60% | $60/year | $600/year |
| Index Mutual Funds | 0.15% | $15/year | $150/year |
| Active Mutual Funds | 1.00% | $100/year | $1,000/year |
| Financial Advisor (1% AUM) | 1.00% | $100/year | $1,000/year |
The compounding impact over 30 years:
Starting with $100,000 and contributing $1,000/month at 10% gross returns:
| Fee Level | Net Return | Value After 30 Years | Fees Paid | Opportunity Cost |
| 0.05% (index ETF) | 9.95% | $2,438,000 | ~$31,000 | Baseline |
| 0.60% (active ETF) | 9.40% | $2,185,000 | ~$284,000 | -$253,000 |
| 1.00% (mutual fund or advisor) | 9.00% | $2,011,000 | ~$458,000 | -$427,000 |
The difference in fees alone can cost you over $400,000 in a lifetime. Low-cost ETFs keep more money working for you instead of paying fund managers and advisors.
Reason #3: No Stock-Picking Required
According to research analyzing individual stock picker performance:
- 88% of individual stock pickers underperform the S&P 500 over 15+ years
- 92% of professional fund managers underperform index funds after fees
- The average investor earns 3-5% less annually than buy-and-hold index investors due to poor timing and stock selection
Why stock picking fails:
| Challenge | Why It’s Hard | How ETFs Solve It |
| Research time | 20-40 hours per stock | Zero hours (index does it) |
| Financial analysis | Need to read statements | Not required |
| Competitive advantage | Must understand business moats | Irrelevant (own them all) |
| Valuation | Must determine fair price | Not needed |
| Selling decisions | When to exit? Most fail here | Hold forever |
| Emotional discipline | Hard to stay rational | Easier with diversification |
Translation: Picking individual stocks is hard. Even professionals fail at it. ETFs remove the need to pick winners—you just own the entire market and capture average returns, which beat most active investors.
Reason #4: Easy to Understand
With ETFs, you know exactly what you own:
- VOO = 500 largest U.S. companies
- VTI = Entire U.S. stock market (3,000+ companies)
- QQQM = 100 largest non-financial Nasdaq companies (tech-heavy)
- SCHD = 100 high-quality dividend-paying U.S. companies
Compare this to individual stocks where you need to understand:
- Business model and revenue streams
- Competitive positioning and market share
- Management quality and corporate governance
- Financial health (debt levels, cash flow, profitability)
- Growth prospects and industry trends
- Valuation metrics (P/E, P/S, P/B ratios)
With ETFs, the strategy is simple: Buy broad market exposure, hold for decades, collect returns. No PhD required.
Reason #5: Proven Long-Term Performance
Historical Returns (1926-2023):
| Investment | Average Annual Return | Best Year | Worst Year | Positive Years |
| S&P 500 Index | 10.3% | +54% (1933) | -43% (1931) | 74 out of 98 (76%) |
| Total Stock Market | 10.1% | Similar | Similar | Similar |
| 60/40 Stocks/Bonds | 8.9% | +35% | -27% | 80 out of 98 (82%) |
According to research by Ibbotson Associates analyzing 98 years of market data, stocks have delivered positive returns in approximately 75% of all years. Over rolling 15-year periods, stocks have been positive 100% of the time historically.
Simple index ETFs capture these market returns automatically without trying to beat them.
Reason #6: Automatic Rebalancing
The index does all the work:
- Companies grow: Their weight in the index increases automatically
- Companies shrink: Their weight decreases automatically
- Companies fail: They’re removed from the index and replaced
- New winners emerge: They’re added to the index automatically
Example: S&P 500 changes over time:
- 1980: Kodak, Polaroid, Blockbuster were major holdings → All eventually removed after decline
- 2000: Yahoo, AOL were top holdings → Shrunk dramatically or removed
- 2010: Apple, Google entered top 10 → Grew to become largest holdings
- 2020: Tesla added to index → Now a major holding
You did nothing. The index automatically shifted from failures to winners. Try doing that with individual stocks—you’d need to constantly monitor, sell losers, and buy winners.
Reason #7: Tax Efficiency
ETFs are more tax-efficient than mutual funds due to their unique structure.
How ETFs minimize taxes:
- No forced distributions: ETFs rarely pay out large capital gains to shareholders
- In-kind redemptions: When investors sell, ETFs transfer shares (not cash), avoiding taxable events
- You control timing: You decide when to sell and realize gains
Mutual funds force you to pay taxes on gains even when you didn’t sell anything, because the fund manager’s trading triggers taxable distributions to all shareholders.
According to Morningstar research, ETFs distribute 1-2% of assets as capital gains annually versus 5-8% for actively managed mutual funds. Over decades, this tax efficiency adds 0.3-0.7% annually to your after-tax returns.
Reason #8: Perfect Fit for FinanceSwami Framework
The FinanceSwami Ironclad Investment Strategy Framework is built around ETFs:
Core principles:
- First $50,000 in simple index ETFs (VOO 70% / QQQM 30%)
- Maintain 85-100% stocks across all ages
- Shift within stocks from growth to dividend focus (not to bonds)
- Keep portfolios simple: 2-5 core holdings maximum
- Ultra-low costs (under 0.20% expense ratios)
- Buy and hold for decades
ETFs are the perfect vehicle for this strategy. They provide:
- Broad diversification with minimal holdings
- Rock-bottom costs that compound wealth
- Simple implementation (buy once, hold forever)
- Tax efficiency for long-term holding
- No active management or stock picking required
Bottom line: ETFs are specifically designed for the kind of patient, long-term, low-cost investing that builds real wealth. They remove complexity, minimize costs, and deliver market returns—which is all you need to become wealthy over time.
Why Passively Managed ETFs Beat Active Strategies
Let me explain why I recommend passively managed etfs over actively managed funds, because this decision will save you hundreds of thousands of dollars over your investing career.
Passive etfs simply track an index. They don’t try to beat the market—they try to match it by owning everything in the index they’re tracking. The S&P 500 ETF owns all 500 companies in the S&P 500. A total stock market ETF owns essentially every publicly traded U.S. company. Simple, automatic, no drama.
Active funds, by contrast, employ managers who try to beat the market by picking winning stocks and avoiding losers. Sounds good in theory. In practice, it fails spectacularly.
Here’s what the data shows: Over 15-year periods, 85-90% of actively managed funds underperform their benchmark index. That means if you invested in 10 actively managed funds, 8-9 of them would have been better off just buying the index through a passive ETF.
Why does active management fail so consistently? Three reasons:
Fees: Active funds charge 0.50% to 1.50% in expense ratios, versus 0.03% to 0.15% for passive etfs. That difference compounds brutally over decades. On a $500,000 portfolio, the difference between 1.00% and 0.03% fees costs you approximately $300,000 over 30 years.
Trading costs: Active managers constantly buy and sell stocks trying to time the market and pick winners. Each trade creates transaction costs and potential tax consequences. Passive etfs hold everything and rarely trade.
Human error: Even professional investors make mistakes. They hold too long, sell too early, chase performance, panic during crashes. Passive etfs eliminate human judgment entirely—they just own the market.
The passive etfs I recommend through the FinanceSwami framework have consistently delivered market returns at rock-bottom costs. That’s all you need. Market returns, compounded over decades, create extraordinary wealth.
When you invest in passively managed etfs, you’re accepting that you’ll never beat the market. But you’re also guaranteeing you’ll never dramatically underperform it either. And since beating the market is nearly impossible (even for professionals), matching it through low-cost passive etfs is the intelligent strategy.
The Benefits of Investing in ETFs for Beginners and Experts Alike
Let me explain why etfs offer benefits that make them the best choice for almost everyone—whether you’re brand new to investing or you’ve been managing money for decades.
Benefit #1: Simplicity that scales
ETFs are easy to understand and easy to implement. A beginner can buy three ETFs and have a complete, diversified portfolio. An expert can use the same ETFs as their foundation. The simplicity doesn’t mean sacrificing sophistication—it means eliminating unnecessary complexity.
Benefit #2: Automatic diversification
When you buy a single broad-market ETF, etfs invest your money across hundreds or thousands of different companies automatically. You don’t need to research individual stocks, analyze balance sheets, or worry about company-specific risks. The diversification is built in.
Benefit #3: Low costs that compound
The etfs I recommend charge 0.03% to 0.20% annually. Compare this to actively managed funds at 0.75% to 1.50%, or financial advisors charging 1% of assets. Over a 40-year investing career, the difference in fees alone can exceed $500,000 on a modest portfolio.
Benefit #4: Tax efficiency
ETFs are structured in a way that minimizes capital gains distributions. This means you keep more of your returns instead of paying them to the IRS every year. The tax efficiency of etfs compared to mutual funds adds approximately 0.3-0.7% to your annual after-tax returns.
Benefit #5: Transparency
ETFs disclose their holdings daily. You always know exactly what you own. This transparency helps you avoid hidden risks and ensures your investments align with your strategy.
Benefit #6: Liquidity
Since etfs trade like stocks on the stock market, you can sell them anytime during market hours and have access to your cash within days. This liquidity provides flexibility without sacrificing long-term growth.
Benefit #7: Proven track record
The ETF structure has worked successfully for decades. The broad-market etfs I recommend have track records spanning 20+ years, proving they work through bull markets, bear markets, crashes, and recoveries.
These benefits compound over time. The simplicity means you’re less likely to make mistakes. The low costs mean more money compounds for you instead of going to fund companies. The tax efficiency means you keep more of what you earn. Together, these advantages create a powerful wealth-building vehicle that works for beginners and experts alike.
This is why I built the FinanceSwami investment framework entirely around ETFs. They’re simply the best tool available for systematic long-term wealth creation.
4. What Makes an ETF “Safe” for Beginners
Not all ETFs are created equal. Some are simple and safe. Others are complex and dangerous. Let me show you how to tell the difference.
The 5 Safety Factors
Factor #1: Broad Diversification
Safe ETFs hold hundreds or thousands of different investments:
- S&P 500 ETF: 500 companies
- Total market ETF: 3,000+ companies
- Total bond market: 10,000+ bonds
Risky ETFs concentrate in narrow areas:
- Single sector (only technology, only biotech)
- Single country (only China, only Brazil)
- Single theme (only cloud computing, only genomics)
- Single commodity (only gold, only oil)
Why it matters: Broad diversification protects you when specific sectors, countries, or themes crash. Narrow concentration can lead to 50-80% losses when that specific area struggles.
Diversification Comparison:
| ETF Type | Holdings | Risk Level | Loss in Sector Crash |
| S&P 500 (VOO) | 500 companies, 11 sectors | Low | 15-25% (diversified impact) |
| Total Market (VTI) | 3,000+ companies | Very Low | 15-25% (even more diversified) |
| Technology Sector (VGT) | 300+ tech companies | Moderate-High | 40-60% (concentrated) |
| Single Stock (AAPL) | 1 company | Very High | 50-100% (complete exposure) |
FinanceSwami rule: For your first $50,000-$100,000 invested, stick to broad market ETFs with 500+ holdings.
Factor #2: Low Expense Ratio
Safe ETFs charge 0.03%-0.20% annually:
- 0.03%: VOO, VTI, FXAIX
- 0.06%: SCHD, VYM
- 0.15%: QQQM
Dangerous ETFs charge 0.50%-2.00% annually:
- 0.50%+: Most actively managed ETFs
- 0.75%+: Many sector and thematic ETFs
- 1.00%+: Leveraged and inverse ETFs
Why it matters: High fees compound against you for decades. A 1% fee difference costs $400,000+ over a 30-year career on a $500,000 portfolio.
Expense Ratio Impact Over 30 Years:
Starting with $50,000, adding $1,000/month, 10% gross return:
| Expense Ratio | Net Return | Final Value | Total Fees Paid | vs. 0.03% Baseline |
| 0.03% | 9.97% | $2,192,000 | $27,000 | Baseline |
| 0.20% | 9.80% | $2,124,000 | $95,000 | -$68,000 |
| 0.50% | 9.50% | $1,991,000 | $228,000 | -$201,000 |
| 1.00% | 9.00% | $1,827,000 | $392,000 | -$365,000 |
FinanceSwami rule: Never pay more than 0.20% for an ETF unless it serves a very specific purpose (like JEPI’s covered call strategy for income).
Factor #3: High Liquidity (Assets Under Management)
Safe ETFs have substantial assets:
- $100B+: VOO, VTI, SPY (extremely safe)
- $10B-$100B: QQQM, SCHD, VYM (very safe)
- $1B-$10B: Acceptable for specialized needs
Risky ETFs have low assets:
- Under $500M: May have liquidity issues
- Under $100M: High risk of fund closure
Why it matters: Low-asset ETFs can close, forcing you to sell and realize taxable gains at an inopportune time. High-asset ETFs are stable and liquid.
Asset Size vs. Safety:
| AUM Range | Risk Level | Likelihood of Closure | Liquidity |
| $100B+ | Very Low | Almost zero | Excellent |
| $10B-$100B | Low | Very unlikely | Excellent |
| $1B-$10B | Low-Moderate | Unlikely | Good |
| $500M-$1B | Moderate | Possible | Fair |
| Under $500M | High | Common | Poor |
FinanceSwami rule: Stick to ETFs with $1B+ in assets for core holdings. You can use smaller ETFs ($500M+) for specialized purposes once you have experience.
Factor #4: Simple Strategy (Passive Index Tracking)
Safe ETFs track well-known indexes passively:
- VOO tracks S&P 500
- VTI tracks Total U.S. Stock Market
- QQQM tracks Nasdaq-100
Risky ETFs use complex strategies:
- Leveraged ETFs: Use debt to amplify returns 2x or 3x (can lose 90%+ in crashes)
- Inverse ETFs: Bet against the market (go up when market goes down)
- Actively managed: Fund manager picks stocks (usually underperforms)
- Complex derivatives: Options, futures, swaps (hard to understand, high fees)
Why it matters: Complex strategies sound sophisticated but usually underperform simple indexing while charging much higher fees. Leverage and inverse strategies are especially dangerous for buy-and-hold investors.
Strategy Comparison:
| ETF Type | Strategy | Complexity | Long-Term Performance | Best For |
| Index tracking | Own everything in index | Very simple | Matches market (~10% annually) | Everyone |
| Dividend focus | Filter for dividend payers | Simple | Slightly below market (~9%) | Income seekers age 50+ |
| Active management | Manager picks stocks | Moderate | Usually underperforms (6-8%) | Almost no one |
| Leveraged (2x-3x) | Use debt to amplify | Complex | Massive volatility, long-term decay | Day traders only |
| Inverse | Bet against market | Complex | Loses money in bull markets | Professional short-term traders |
FinanceSwami rule: Use only passive index-tracking ETFs and dividend-focused ETFs. Avoid leveraged, inverse, and actively managed ETFs.
Factor #5: Transparent Holdings
Safe ETFs publish full holdings daily or monthly:
- You can see exactly what companies you own
- No surprises or hidden risks
- Easy to verify diversification
Risky ETFs have opaque or frequently changing holdings:
- Actively managed ETFs may only disclose quarterly
- Leveraged and derivative-based ETFs hard to analyze
- Can’t verify what you actually own
Why it matters: Transparency lets you verify the ETF matches your goals and risk tolerance. Opaque funds can hide concentration risks or strategy drift.
The “Beginner-Safe” Checklist
Use this checklist to evaluate any ETF:
□ Broad diversification: 500+ holdings minimum
□ Low expense ratio: 0.20% or less (0.35% acceptable for covered call ETFs)
□ High assets: $1B+ AUM
□ Simple strategy: Passive index tracking or dividend focus
□ Transparent holdings: Full disclosure available
□ Established track record: 3+ years of history
□ Major provider: Vanguard, Fidelity, Schwab, BlackRock, Invesco
If an ETF checks all 7 boxes, it’s safe for beginners. If it misses 3 or more, avoid it.
Red Flags: ETFs to Avoid
Immediate disqualifiers for beginners:
| Red Flag | Why It’s Dangerous | Example |
| “2X” or “3X” in name | Leveraged, can lose 80-90% in crashes | TQQQ, UPRO, SOXL |
| “Inverse” or “Short” | Bets against market, loses in bull runs | SQQQ, SH, DOG |
| Expense ratio over 0.75% | Excessive fees eat returns | Many actively managed |
| Assets under $100M | High closure risk | Countless small thematic ETFs |
| Recently launched (under 1 year) | No track record, unproven | New thematic fads |
| Obscure provider | May lack support, higher closure risk | Unknown fund companies |
If you see any of these red flags, don’t buy. There are plenty of safe options—you don’t need risky ETFs.
Real Example: Safe vs. Risky ETFs
Let me show you the difference in practice:
Safe Choice: VOO (Vanguard S&P 500 ETF)
✓ 500 large-cap companies (broad)
✓ 0.03% expense ratio (ultra-low)
✓ $450B+ assets (massive)
✓ Tracks S&P 500 passively (simple)
✓ Full holdings disclosed (transparent)
✓ 15+ year track record
✓ Vanguard (major provider)
Result: Extremely safe for beginners, proven long-term returns
Risky Choice: TQQQ (ProShares UltraPro QQQ)
✗ Same 100 stocks as QQQ but leveraged 3x (concentrated + leveraged)
✗ 0.86% expense ratio (expensive for leverage)
✗ Uses derivatives (complex)
✗ Extreme volatility (can drop 80% in crashes)
✗ Not suitable for buy-and-hold
Result: Extremely dangerous for beginners, designed for day traders
Same underlying companies (Nasdaq-100), completely different risk profiles. VOO is safe. TQQQ is gambling.
5. Understanding Fixed-Income ETFs and When They Fit
I need to address fixed-income etfs because you’ll see them recommended everywhere, and I want you to understand why I’m generally cautious about them—especially if you’re under age 65.
Fixed-income ETFs primarily hold bonds—government bonds, corporate bonds, municipal bonds, or a mix. They’re called “fixed income” because they generate predictable interest payments. Traditional financial advisors love recommending them because bonds are perceived as “safe” and “stabilizing.”
Here’s my perspective, which differs from mainstream advice: bonds are generally appropriate only for investors who need stability more than growth, and that usually means people in or approaching retirement. If you’re under 65, I believe dividend-paying stocks and equity etfs can provide both income and growth potential that bonds simply cannot match.
Let me be specific about when fixed-income etfs make sense in the FinanceSwami framework:
Under age 55: 0% allocation to fixed-income etfs. Your time horizon is long enough that you should be entirely in equity etfs. The stability bonds provide isn’t worth the opportunity cost of missing stock market returns.
Ages 55-64: If you absolutely must have some bond exposure for psychological comfort, you could allocate 5-10% to a total bond market ETF like BND. But I’d prefer you achieve stability through dividend-focused equity etfs instead—they provide income while maintaining inflation protection.
Age 65+: This is when fixed-income etfs become more reasonable. Even here, I recommend only 10-15% maximum allocation. The rest of your portfolio should remain in dividend-paying stocks and equity etfs that generate sustainable cash flow.
Why am I so cautious about bonds? Because bonds have three significant limitations:
Inflation erosion: Bond interest rates often barely keep pace with inflation. A 4% bond yield sounds nice until you realize inflation is eating 3% of your purchasing power annually.
Opportunity cost: Every dollar in bonds is a dollar not invested in stocks. Over decades, that opportunity cost is massive—potentially hundreds of thousands of dollars in missed growth.
Limited upside: Bonds can only go up so much. Stocks have unlimited upside potential. When you’re building wealth, you want unlimited upside
If you’re new to etfs and wondering whether you should include fixed-income etfs in your portfolio, my answer is almost always no—not until you’re approaching retirement and need your portfolio to generate stable cash flow with minimal volatility.
Instead of investing in bond ETFs, invest in dividend-focused equity etfs like SCHD or VYM. They provide income (often higher than bonds), growth potential, and inflation protection. That’s a better combination for most investors under 65.
6. The 8 Core ETFs Every Beginner Should Know
Let me introduce you to the 8 ETFs that should form the foundation of every beginner’s portfolio. These aren’t trendy picks or complex strategies—they’re boring, proven funds that have built wealth for millions of investors.
Core ETF #1: VOO (Vanguard S&P 500 ETF)
What it is: Tracks the S&P 500 index—the 500 largest publicly traded U.S. companies.
What you own: America’s biggest, most established companies including:
- Technology: Apple, Microsoft, Nvidia, Google
- Finance: Berkshire Hathaway, JPMorgan Chase, Bank of America
- Healthcare: UnitedHealth, Johnson & Johnson, Eli Lilly
- Consumer: Amazon, Tesla, Walmart, Coca-Cola
- And 492 others across all 11 sectors
Key Statistics:
- Ticker: VOO
- Expense Ratio: 0.03% ($3 per year on $10,000)
- Assets Under Management: $450B+
- Holdings: 500 companies
- Share Price: ~$450
- Dividend Yield: ~1.5%
- Historical Return: ~10% annually (since 1926)
Why it’s perfect for beginners:
This is the single best ETF for beginners. It’s been the backbone of wealth-building for decades. When you hear “the stock market went up,” this is usually what people mean. Owning VOO means you own America’s economy.
Who should buy it:
Everyone. This should be the foundation of every beginner’s portfolio, regardless of age. According to the FinanceSwami Ironclad Investment Strategy Framework, VOO (or equivalent S&P 500 fund) should represent 60-80% of your portfolio when young, decreasing to 15-40% as you shift to dividend focus after age 50.
Core ETF #2: VTI (Vanguard Total Stock Market ETF)
What it is: Tracks the entire U.S. stock market—every publicly traded company from giants to tiny firms.
What you own: Everything in VOO plus:
- Mid-cap companies (3,000+ additional companies)
- Small-cap companies
- Micro-cap companies
- Total coverage of the U.S. economy
Key Statistics:
- Ticker: VTI
- Expense Ratio: 0.03% ($3 per year on $10,000)
- Assets Under Management: $400B+
- Holdings: 3,500+ companies
- Share Price: ~$260
- Dividend Yield: ~1.4%
- Historical Return: ~10% annually (similar to S&P 500)
Why it’s perfect for beginners:
VTI gives you even broader diversification than VOO by including mid-cap and small-cap companies. Performance is nearly identical to VOO over long periods (within 0.1-0.2% annually), but you own literally the entire U.S. stock market.
VOO vs. VTI Comparison:
| Feature | VOO | VTI |
| Holdings | 500 large companies | 3,500+ all sizes |
| Expense Ratio | 0.03% | 0.03% |
| 10-Year Return | 12.8% annually | 12.9% annually |
| Volatility | Moderate | Slightly higher |
| Best for | Large-cap focus | Total market exposure |
Who should buy it:
Anyone who wants the absolute broadest U.S. diversification. You can use VTI instead of VOO—they’re interchangeable for beginners. Pick whichever one you prefer and stick with it.
FinanceSwami note: I slightly prefer VOO because the S&P 500 represents 82% of total U.S. market value anyway, and limiting to large-caps provides modest quality screening. But both are excellent.
Core ETF #3: QQQM (Invesco Nasdaq-100 ETF)
What it is: Tracks the Nasdaq-100—the 100 largest non-financial companies on the Nasdaq exchange.
What you own: The most innovative, growth-focused U.S. companies:
- Technology (50%+): Apple, Microsoft, Nvidia, Google, Meta, Tesla
- Consumer services: Amazon, Netflix, Costco
- Healthcare: Moderna, Regeneron
- Communication: Alphabet, Meta
Key Statistics:
- Ticker: QQQM
- Expense Ratio: 0.15% ($15 per year on $10,000)
- Assets Under Management: $30B+
- Holdings: 100 companies
- Share Price: ~$185
- Dividend Yield: ~0.6%
- Historical Return: ~14% annually (last 15 years, higher volatility)
Why it’s perfect for beginners:
QQQM provides aggressive growth exposure to the technology and innovation economy. It’s more volatile than VOO/VTI but has delivered higher returns historically. Perfect for investors under 40 who want growth and can handle volatility.
Why QQQM instead of QQQ?
Both track the same Nasdaq-100 index, but QQQM has a lower expense ratio (0.15% vs. 0.20%). QQQM is the newer, cheaper version. Always choose QQQM.
Who should buy it:
Investors under 40 seeking growth. According to the FinanceSwami Framework, QQQM should represent 20-30% of your portfolio when young (ages 25-40), then decrease to 0% by age 45 as you shift to dividend focus.
Core ETF #4: SCHD (Schwab U.S. Dividend Equity ETF)
What it is: Tracks an index of 100 high-quality U.S. dividend-paying stocks with consistent dividend growth.
What you own: Established, profitable companies with strong cash flow:
- Finance: JPMorgan Chase, Bank of America, Blackstone
- Healthcare: AbbVie, Pfizer, Merck
- Consumer staples: Coca-Cola, Pepsi, Procter & Gamble
- Industrials: Caterpillar, 3M, Lockheed Martin
- Energy: Chevron, Exxon Mobil
Key Statistics:
- Ticker: SCHD
- Expense Ratio: 0.06% ($6 per year on $10,000)
- Assets Under Management: $60B+
- Holdings: 100 companies
- Share Price: ~$80
- Dividend Yield: ~3.5%
- Historical Return: ~13% annually (last 10 years including dividends)
Why it’s perfect for beginners (especially age 40+):
SCHD focuses on quality dividend growth companies—businesses that not only pay dividends but consistently increase them. This provides:
- Growing income stream (dividends rise 7-10% annually on average)
- Capital appreciation (stock prices grow with earnings)
- Lower volatility than pure growth stocks
- Inflation protection (dividends grow faster than inflation)
Dividend Growth Example:
If you invest $100,000 in SCHD at 3.5% yield:
| Year | Dividend Yield | Annual Dividends | Cumulative Dividends |
| Year 1 | 3.5% | $3,500 | $3,500 |
| Year 5 | 4.2% (7% growth) | $4,900 | $20,000 |
| Year 10 | 5.4% | $7,050 | $51,000 |
| Year 20 | 9.1% | $15,000 | $180,000 |
Dividends grow while your original $100,000 also compounds in value.
Who should buy it:
According to the FinanceSwami Framework:
- Ages 35-40: Begin adding 10-20% SCHD
- Ages 41-50: Increase to 30-40% SCHD
- Ages 51-60: Increase to 50-60% SCHD
- Ages 61+: Maintain 50-70% SCHD for income
SCHD is the cornerstone of the FinanceSwami dividend-focused retirement strategy.
Core ETF #5: VYM (Vanguard High Dividend Yield ETF)
What it is: Tracks an index of approximately 400 U.S. stocks that pay above-average dividends.
What you own: Broader dividend coverage than SCHD:
- More holdings (400+ vs. 100)
- Includes REITs and utilities
- Lower average yield but more diversification
- Similar quality companies
Key Statistics:
- Ticker: VYM
- Expense Ratio: 0.06% ($6 per year on $10,000)
- Assets Under Management: $50B+
- Holdings: 400+ companies
- Share Price: ~$125
- Dividend Yield: ~3.0%
- Historical Return: ~10% annually including dividends
SCHD vs. VYM Comparison:
| Feature | SCHD | VYM |
| Holdings | 100 companies | 400+ companies |
| Dividend Yield | 3.5% | 3.0% |
| Dividend Growth Focus | Strong | Moderate |
| Diversification | Concentrated quality | Broader |
| Volatility | Lower | Lower |
| Best for | Dividend growth | Broad dividend exposure |
Why it’s perfect for beginners:
VYM provides broader diversification than SCHD while still focusing on dividend payers. It’s slightly more conservative (lower yield, more holdings) and works well in combination with SCHD.
Who should buy it:
Use VYM to complement SCHD starting at age 45+. According to the FinanceSwami Framework, you can split your dividend allocation between SCHD and VYM (for example, 30% SCHD + 20% VYM = 50% total dividend).
Core ETF #6: JEPI (JPMorgan Equity Premium Income ETF)
What it is: An actively managed ETF that combines S&P 500 stocks with covered call options to generate high monthly income.
What you own:
- Portfolio of S&P 500 stocks (low volatility focus)
- Covered call options that generate premium income
- Monthly dividend distributions
Key Statistics:
- Ticker: JEPI
- Expense Ratio: 0.35% (higher due to active management + options)
- Assets Under Management: $35B+
- Holdings: 100-150 stocks + options
- Share Price: ~$57
- Dividend Yield: ~7-9% (varies with market conditions)
- Historical Return: ~9-10% total return (price + dividends)
Why it’s different:
JEPI uses a covered call strategy—selling call options on the stocks it owns to generate extra income. This provides:
- Much higher income (~7-9% vs. 3-4% for typical dividends)
- Monthly payments (most ETFs pay quarterly)
- Lower price volatility
- Lower total returns than pure stock ETFs (trades growth for income)
Trade-off:
JEPI sacrifices some capital appreciation for higher income. In strong bull markets, it underperforms VOO. In sideways or declining markets, it outperforms due to option premiums.
Performance Comparison (2020-2023):
| Year | VOO Total Return | JEPI Total Return | Notes |
| 2020 | +18.4% | N/A (launched Oct 2020) | — |
| 2021 | +28.7% | +15.2% | Bull market: VOO wins |
| 2022 | -18.1% | -1.5% | Bear market: JEPI wins dramatically |
| 2023 | +26.3% | +9.8% | Bull market: VOO wins |
| Average | +13.8% | +7.8% | JEPI trades growth for 7-9% income |
Who should buy it:
According to the FinanceSwami Framework, JEPI is best for:
- Ages 60+: Use 10-30% for high monthly income
- Retirees: Provides steady monthly cash flow
- Conservative investors: Lower volatility, high income
FinanceSwami note: JEPI is relatively new (launched 2020) but has proven itself through a full market cycle including 2022 bear market. The 0.35% expense ratio is justified by the income generation and active management.
Core ETF #7: JEPQ (JPMorgan Nasdaq Equity Premium Income ETF)
What it is: Similar to JEPI but focuses on Nasdaq-100 stocks instead of S&P 500—combining tech growth with covered call income.
What you own:
- Portfolio of Nasdaq-100 tech stocks
- Covered call options for premium income
- Monthly dividend distributions
Key Statistics:
- Ticker: JEPQ
- Expense Ratio: 0.35%
- Assets Under Management: $15B+
- Holdings: 80-120 stocks + options
- Share Price: ~$58
- Dividend Yield: ~9-11% (higher than JEPI due to tech volatility)
- Historical Return: ~10-12% total return (newer fund, limited history)
JEPI vs. JEPQ Comparison:
| Feature | JEPI | JEPQ |
| Underlying Index | S&P 500 (broad) | Nasdaq-100 (tech-heavy) |
| Dividend Yield | 7-9% | 9-11% |
| Volatility | Lower | Higher (tech focus) |
| Growth Potential | Moderate | Higher (but limited by calls) |
| Best for | Conservative income | Moderate income + some growth |
Why it’s perfect for specific situations:
JEPQ gives you tech exposure with high income—a unique combination. Most tech stocks pay little to no dividends, but JEPQ generates 9-11% income from tech holdings through covered calls.
Who should buy it:
According to the FinanceSwami Framework, JEPQ works for:
- Ages 55-65: Transitioning from growth (QQQM) to income, JEPQ bridges the gap
- Tech enthusiasts: Want tech exposure with income generation
- Higher risk tolerance: Comfortable with tech volatility for higher yield
FinanceSwami note: JEPQ is newer than JEPI (launched 2022) with less track record. Use cautiously, limited to 10-20% of portfolio maximum until it proves itself over full market cycle.
Core ETF #8: BND (Vanguard Total Bond Market ETF)
What it is: Tracks the entire U.S. investment-grade bond market—government and corporate bonds.
What you own:
- U.S. Treasury bonds (government debt)
- Investment-grade corporate bonds
- Mortgage-backed securities
- Approximately 10,000 individual bonds
Key Statistics:
- Ticker: BND
- Expense Ratio: 0.03% ($3 per year on $10,000)
- Assets Under Management: $100B+
- Holdings: 10,000+ bonds
- Share Price: ~$73
- Dividend Yield: ~4.5% (varies with interest rates)
- Historical Return: ~3-5% annually (depends on rate environment)
Why bonds exist in portfolios:
Traditional advice says bonds provide:
- Stability (less volatile than stocks)
- Income (interest payments)
- Diversification (move differently than stocks)
FinanceSwami perspective on bonds:
According to the FinanceSwami Ironclad Investment Strategy Framework, bonds are over-allocated in most portfolios. High-quality dividend stocks can provide income with better inflation protection and growth potential.
Recommended bond allocation:
- Ages 25-54: 0% bonds
- Ages 55-64: 0-10% bonds
- Ages 65+: 10-15% bonds maximum
Why minimal bonds:
Bonds currently yield ~4-5% with no growth potential. Quality dividend stocks yield 3-4% with dividend growth of 7-10% annually plus capital appreciation. Over decades, dividend stocks dramatically outperform bonds for total returns while providing growing income.
Who should buy it:
According to FinanceSwami Framework, use BND only if:
- You’re 65+ and want true stability for a small portion
- You have very low risk tolerance and need psychological comfort
- You’re nearing a major expense in 3-5 years and need capital protection
For everyone else, dividend ETFs (SCHD, VYM, JEPI) provide better income and total returns.
The 8 Core ETFs Summary Table
| ETF | Type | Expense Ratio | Yield | Best For | FinanceSwami Allocation |
| VOO | S&P 500 Index | 0.03% | 1.5% | Everyone | 60-80% (young), 15-40% (older) |
| VTI | Total U.S. Market | 0.03% | 1.4% | Total market exposure | Alternative to VOO |
| QQQM | Nasdaq-100 Growth | 0.15% | 0.6% | Ages 25-40 | 20-30% (young), 0% (age 45+) |
| SCHD | Dividend Growth | 0.06% | 3.5% | Ages 35+ | 10-70% (increasing with age) |
| VYM | High Dividend | 0.06% | 3.0% | Ages 45+ | 0-30% (complement to SCHD) |
| JEPI | Covered Call Income | 0.35% | 7-9% | Ages 60+ | 10-30% (retirees) |
| JEPQ | Tech Income | 0.35% | 9-11% | Ages 55-65 | 10-20% (transitional) |
| BND | Total Bond Market | 0.03% | 4.5% | Ages 65+ | 0-15% maximum |
With these 8 ETFs, you can build a complete portfolio for any age, risk tolerance, or financial goal. You don’t need 50 ETFs. You need the right 2-4 from this list.
7. Choosing the Right ETFs for Your Situation
Let me address something I hear constantly: “There are literally thousands of ETFs to choose from—how do I know which ones are right?”
I understand why this feels overwhelming. Walk into any brokerage platform and you’ll see thousands of etfs available for purchase. But here’s what you need to understand: you don’t need to evaluate all of them. You need to understand what you’re trying to accomplish, and then select etfs that match your goals.
The choice of etfs that actually matter for beginners is remarkably small. Out of those thousands of ETFs, maybe 10-15 are genuinely useful for building long-term wealth as a beginner. Everything else is either too specialized, too expensive, too risky, or too narrow for someone just starting out.
Here’s my framework for how to select etfs intelligently:
First, understand the different types of etfs:
- Broad market equity etfs (like VOO, VTI) give you the entire stock market
- Growth-focused equity etfs (like QQQM) concentrate on high-growth companies
- Dividend-focused equity etfs (like SCHD, VYM) emphasize income-generating stocks
- Bond ETFs (which I only recommend at age 65+, and even then sparingly)
- International etfs (optional for additional diversification, but U.S. stocks should be your foundation)
The etfs you want depend on your age and goals. A 25-year-old should focus on equity etfs with maximum growth potential. A 60-year-old should shift toward dividend-focused equity etfs that generate income. But both should be primarily invested in stocks, not bonds—that’s where the FinanceSwami philosophy differs from traditional advice.
When beginners ask me which etfs are right for them, I tell them to start with 2-3 core holdings: a broad market ETF (VOO or VTI), potentially a growth-focused ETF (QQQM), and later add dividend ETFs as you age. That’s the complete strategy. The etfs based on this framework will serve you for decades.
8. How to Choose Between Similar ETFs – Comparing ETF Features Side-by-Side
Let me show you how to make smart choices when comparing similar ETFs—like VOO vs. VTI, or SCHD vs. VYM.
The 6-Point Comparison Framework
When comparing two similar ETFs, evaluate them across six dimensions:
1. Expense Ratio (Cost)
Always prefer the lower expense ratio if everything else is equal.
Example: S&P 500 ETFs
| ETF | Provider | Expense Ratio | Annual Cost on $10,000 |
| FXAIX | Fidelity | 0.015% | $1.50 |
| VOO | Vanguard | 0.03% | $3.00 |
| IVV | BlackRock | 0.03% | $3.00 |
| SPY | State Street | 0.09% | $9.00 |
All four track the exact same index (S&P 500). FXAIX is cheapest, but VOO/IVV are nearly identical. SPY is more expensive with no benefit—avoid it.
Winner: FXAIX or VOO (difference is negligible)
2. Assets Under Management (Size & Safety)
Prefer larger ETFs—they’re more stable, liquid, and unlikely to close.
Example: Dividend Growth ETFs
| ETF | Strategy | AUM | Closure Risk |
| SCHD | Dividend growth | $60B+ | Almost zero |
| VIG | Dividend growth | $80B+ | Almost zero |
| DGRO | Dividend growth | $25B | Very low |
| FVD | Dividend growth | $2B | Moderate |
SCHD and VIG are both extremely safe due to size. DGRO is acceptable. FVD is riskier.
Winner: VIG or SCHD (both have massive assets)
3. Holdings (Diversification)
More holdings generally = more diversification = lower risk (with some exceptions).
Example: Dividend ETFs
| ETF | Holdings | Diversification Level |
| VYM | 400+ companies | Very broad |
| SCHD | 100 companies | Concentrated quality |
| NOBL | 67 companies | Highly concentrated |
VYM offers most diversification. SCHD offers concentrated quality (which can be better). NOBL is very concentrated (higher risk).
Winner: Depends on preference—VYM for diversification, SCHD for quality
4. Performance History (Track Record)
Compare total returns over 5+ years (not just recent performance).
Example: S&P 500 vs. Nasdaq-100 (2013-2023)
| ETF | Index | 10-Year Return | Volatility |
| VOO | S&P 500 | 12.8% annually | Moderate |
| QQQM | Nasdaq-100 | 18.5% annually | High |
QQQM delivered higher returns but with more volatility. VOO provided steadier returns.
Winner: Depends on risk tolerance—QQQM for growth (young investors), VOO for stability (all ages)
5. Dividend Yield (Income)
If your goal is income, compare current yield and dividend growth history.
Example: Income-Focused ETFs
| ETF | Current Yield | 5-Year Dividend Growth | Income Reliability |
| JEPI, JEPQ | 9-11% | N/A (new fund) | High (monthly, options-based) |
| SCHD | 3.5% | 10% annually | Very high (quarterly, earnings-based) |
| VYM | 3.0% | 7% annually | Very high (quarterly, diversified) |
JEPI provides highest current income. SCHD provides fastest growing income. VYM provides most diversified income.
Winner: Depends on need—JEPI for retirees needing cash now, SCHD for growing income over time
6. Tax Efficiency (After-Tax Returns)
Some ETFs are more tax-efficient than others.
Example: Tax Efficiency Comparison
| ETF | Capital Gains Distributions | Tax Efficiency |
| VOO | Minimal (0.1-0.5% annually) | Excellent |
| SCHD | Low (0.5-1.0% annually) | Very Good |
| JEPI | N/A (all income via dividends) | Good (but dividends taxed) |
| Managed fund | High (3-8% annually) | Poor |
Index ETFs like VOO are most tax-efficient. Dividend ETFs distribute regular dividends (taxed annually). Covered call ETFs like JEPI distribute high dividends (taxed at ordinary rates if held under 1 year).
Winner: VOO for tax efficiency, but this matters most in taxable accounts (not IRAs)
Common ETF Comparison Scenarios
Scenario #1: VOO vs. VTI (Which S&P 500 / Total Market ETF?)
Both are excellent. The differences are negligible:
- VOO: 500 large companies, 82% of U.S. market value
- VTI: 3,500+ all sizes, 100% of U.S. market value
- Performance difference: 0.1-0.2% annually (VTI slightly higher)
- Expense ratio: Identical (0.03%)
FinanceSwami recommendation: Pick either one and stick with it. I slightly prefer VOO for the quality screening implicit in large-caps, but VTI is equally excellent.
Scenario #2: SCHD vs. VYM (Which Dividend ETF?)
Both are excellent dividend ETFs with different strengths:
SCHD strengths:
- Higher yield (3.5% vs. 3.0%)
- Faster dividend growth (focus on growers)
- Better quality screening
- Slightly higher total returns historically
VYM strengths:
- More diversification (400+ vs. 100)
- Broader sector coverage
- Lower concentration risk
- Includes REITs
FinanceSwami recommendation: Use SCHD as your primary dividend holding. Add VYM for additional diversification if desired. Typical split: 60% SCHD / 40% VYM for dividend allocation.
Scenario #3: QQQ vs. QQQM (Which Nasdaq-100 ETF?)
These track the identical index (Nasdaq-100). Only difference is expense ratio:
- QQQ: 0.20% expense ratio, more liquid (higher volume)
- QQQM: 0.15% expense ratio, slightly less liquid
FinanceSwami recommendation: Always choose QQQM. The 0.05% savings ($5 per year per $10,000) compounds to thousands over decades. The liquidity difference is irrelevant for buy-and-hold investors.
Scenario #4: JEPI vs. JEPQ (Which Covered Call ETF?)
Both use covered calls but different underlying stocks:
JEPI (S&P 500-based):
- Lower volatility
- Slightly lower yield (7-9%)
- More conservative
- Proven track record (2020 launch)
JEPQ (Nasdaq-100-based):
- Higher volatility
- Slightly higher yield (9-11%)
- More growth-oriented
- Newer (2022 launch)
FinanceSwami recommendation: Use JEPI for conservative income (ages 65+). Use JEPQ if you want tech exposure with income (ages 55-65). Don’t use both—pick one based on risk tolerance.
Decision-Making Flowchart
Choosing Your Core ETF (Ages 25-40):
Start → Need broad U.S. exposure? → Yes → Choose VOO or VTI (either is fine)
→ Want growth focus? → Yes → Add 20-30% QQQM
→ Done. Portfolio: 70% VOO + 30% QQQM
Choosing Your Dividend ETF (Ages 40+):
Start → Need dividend income? → Yes → Choose SCHD (primary)
→ Want more diversification? → Yes → Add VYM (20-30% of dividend allocation)
→ Need higher current income? → Yes (age 60+) → Add JEPI (10-30%)
→ Done. Portfolio: 40% VOO + 35% SCHD + 15% VYM + 10% JEPI
The “Good Enough” Principle
Here’s an important truth: The difference between good ETFs is usually tiny (0.1-0.3% annually). Obsessing over which exact ETF to buy is far less important than:
- Actually starting to invest
- Investing consistently every month
- Staying invested for decades
- Keeping costs low (under 0.20%)
- Maintaining proper diversification
VOO vs. VTI? Doesn’t matter much—pick one.
SCHD vs. VYM? Both are excellent—use either or both.
IVV vs. VOO? Identical index, negligible cost difference.
The most important decision is investing, not which exact ETF you choose. Any of the 8 core ETFs I’ve recommended will build wealth. The specific combination matters far less than consistency and patience.
6. Simple Portfolio Combinations (Ready to Use)
Let me show you proven portfolio combinations you can implement today. These follow the FinanceSwami Ironclad Investment Strategy Framework and are organized by age and goals.
Portfolio Level 1: Ultra-Simple (1-2 ETFs)
Best for: Complete beginners, first $10,000-$50,000 invested, anyone who wants maximum simplicity.
Option A: Single-ETF Portfolio
- 100% VOO or 100% VTI
That’s it. One fund. Own everything.
Why it works:
- Instant diversification (500-3,500 companies)
- Ultra-low cost (0.03%)
- Zero complexity
- Proven 10% annual returns over decades
Who should use this: Anyone age 25-65 who wants simplicity above all else.
Option B: Two-ETF Growth Portfolio (Ages 25-40)
- 70% VOO (S&P 500)
- 30% QQQM (Nasdaq-100 growth)
Why it works:
- Broad base (VOO) + growth tilt (QQQM)
- Still very simple (only 2 funds)
- Higher return potential than VOO alone
- Appropriate for long time horizon
Who should use this: Investors ages 25-40 with 20+ years until retirement.
Example allocation with $10,000:
| ETF | Allocation | Dollar Amount | Shares to Buy (approx) |
| VOO | 70% | $7,000 | 15.5 shares @ $450 |
| QQQM | 30% | $3,000 | 16 shares @ $185 |
Portfolio Level 2: Balanced (3-4 ETFs)
Best for: Intermediate investors, $50,000+ invested, wanting income and growth balance.
Option A: Balanced Growth + Dividend (Ages 35-50)
- 50% VOO (broad market)
- 20% QQQM (growth)
- 30% SCHD (dividend growth)
Why it works:
- Maintains growth through VOO + QQQM
- Begins building dividend income (SCHD)
- Balanced between appreciation and income
- Appropriate for mid-career investors
Performance expectations:
- Expected return: 10-11% annually
- Dividend yield: ~1.5% overall
- Volatility: Moderate
Example allocation with $100,000:
| ETF | Allocation | Dollar Amount | Estimated Annual Dividends |
| VOO | 50% | $50,000 | $750 (1.5% yield) |
| QQQM | 20% | $20,000 | $120 (0.6% yield) |
| SCHD | 30% | $30,000 | $1,050 (3.5% yield) |
| Total | 100% | $100,000 | $1,920/year |
Option B: Income-Focused (Ages 50-60)
- 40% VOO (broad market)
- 40% SCHD (dividend growth)
- 20% VYM (high dividend)
Why it works:
- Maintains growth through VOO
- Heavy dividend focus (60% in dividend ETFs)
- Diversified dividend exposure
- Transitioning toward income for retirement
Performance expectations:
- Expected return: 9-10% annually
- Dividend yield: ~2.5% overall
- Volatility: Moderate-Low
Example allocation with $250,000:
| ETF | Allocation | Dollar Amount | Estimated Annual Dividends |
| VOO | 40% | $100,000 | $1,500 |
| SCHD | 40% | $100,000 | $3,500 |
| VYM | 20% | $50,000 | $1,500 |
| Total | 100% | $250,000 | $6,500/year |
Portfolio Level 3: Complete (4-5 ETFs)
Best for: Advanced investors, $250,000+ invested, seeking optimized income and growth.
Option A: Pre-Retirement Income Builder (Ages 55-65)
- 30% VOO (broad market growth)
- 35% SCHD (dividend growth)
- 20% VYM (broad dividend)
- 10% JEPI (covered call income)
- 5% BND (bonds, optional)
Why it works:
- Maintains meaningful growth exposure (VOO)
- Heavy dividend focus (65% in dividends)
- Adds high-yield covered calls (JEPI)
- Small bond allocation for stability (optional)
- Generates substantial income for retirement
Performance expectations:
- Expected return: 8-9% annually
- Dividend yield: ~3.5-4.0% overall
- Volatility: Moderate-Low
Example allocation with $500,000:
| ETF | Allocation | Dollar Amount | Annual Dividends | Monthly Income |
| VOO | 30% | $150,000 | $2,250 | $188 |
| SCHD | 35% | $175,000 | $6,125 | $510 |
| VYM | 20% | $100,000 | $3,000 | $250 |
| JEPI | 10% | $50,000 | $4,000 | $333 |
| BND | 5% | $25,000 | $1,125 | $94 |
| Total | 100% | $500,000 | $16,500/year | $1,375/month |
Option B: Full Retirement Income (Ages 65+)
- 15% VOO (modest growth)
- 50% SCHD (primary dividend income)
- 20% VYM (diversified dividend)
- 15% JEPI (covered call income)
Why it works:
- Minimizes pure growth, maximizes income
- Generates 4-5% yield from sustainable dividends
- JEPI provides boost to monthly cash flow
- Still maintains some growth through VOO
- Appropriate for living off portfolio
Performance expectations:
- Expected return: 7-8% annually
- Dividend yield: ~4.5-5.0% overall
- Volatility: Low
Example allocation with $1,000,000:
| ETF | Allocation | Dollar Amount | Annual Dividends | Monthly Income |
| VOO | 15% | $150,000 | $2,250 | $188 |
| SCHD | 50% | $500,000 | $17,500 | $1,458 |
| VYM | 20% | $200,000 | $6,000 | $500 |
| JEPI | 15% | $150,000 | $12,000 | $1,000 |
| Total | 100% | $1,000,000 | $37,750/year | $3,146/month |
Generates $3,146/month in dividends alone, enough to live on for many retirees.
FinanceSwami Framework Portfolios by Age
Here’s the complete progression following the FinanceSwami Ironclad Investment Strategy Framework:
Ages 25-35: Pure Growth
- 70% VOO
- 30% QQQM
Target: Maximum growth, minimal income needed
Ages 36-45: Growth with Emerging Dividends
- 50% VOO
- 20% QQQM
- 30% SCHD
Target: Maintain growth, begin dividend base
Ages 46-55: Balanced Growth and Income
- 45% VOO
- 40% SCHD
- 15% VYM
Target: Equal focus on appreciation and income
Ages 56-64: Income Priority with Growth
- 30% VOO
- 40% SCHD
- 20% VYM
- 10% JEPI
Target: Generate substantial income, maintain some growth
Ages 65+: Maximum Income
- 15% VOO
- 50% SCHD
- 20% VYM
- 15% JEPI
Target: Live off dividends, preserve capital
Portfolio Implementation Worksheet
Use this to plan your exact allocation:
Your Information:
- Current age: _______
- Portfolio size: $_______
- Risk tolerance: Low / Moderate / High
- Primary goal: Growth / Balanced / Income
Your Selected Portfolio:
| ETF | Target % | Dollar Amount | Shares to Buy |
| _______ | _____% | $_______ | _______ |
| _______ | _____% | $_______ | _______ |
| _______ | _____% | $_______ | _______ |
| _______ | _____% | $_______ | _______ |
| Total | 100% | $_______ |
Expected Performance:
- Expected annual return: _______% (use 10% for growth, 8% for income)
- Expected annual dividends: $_______
- Expected monthly dividends: $_______
Implementation Date: _______
Next Review Date: _______ (one year from implementation)
The “Set and Forget” Rule
Once you’ve chosen your portfolio:
- Buy the allocation once
- Set up automatic monthly contributions with same percentages
- Review once per year on December 31st
- Rebalance only if allocation drifts 5%+ from target
- Shift allocation every 5 years as you age (gradually, not suddenly)
Don’t:
- Check daily or weekly
- React to market moves
- Try to time purchases
- Constantly adjust percentages
- Add more ETFs “for diversification”
The portfolios I’ve shown you are complete. You don’t need more ETFs. You don’t need complex strategies. These simple combinations will build substantial wealth over decades.
9. ETFs by Age and Risk Tolerance
Let me show you how to adjust ETF selection based on your age and risk tolerance. Not everyone should use the same portfolio—your investments should match your life stage and comfort with volatility.
The Age-Based Framework
As you age, your investing needs change:
Young (20s-30s): Maximum growth, long time horizon, can handle volatility
Mid-career (40s-50s): Balanced growth and income, building for retirement
Pre-retirement (late 50s-early 60s): Income focus, preserving capital, reducing volatility
Retirement (65+): Living off portfolio, minimizing risk, generating cash flow
Portfolio Recommendations by Age
Ages 22-30: Pure Growth Phase
Time Horizon: 35-45 years until retirement
Risk Tolerance: Should be high (time to recover from crashes)
Primary Goal: Maximum wealth accumulation
Conservative (Low Risk Tolerance):
- 85% VOO
- 15% SCHD
- 0% bonds
Moderate (Medium Risk Tolerance):
- 70% VOO
- 30% QQQM
- 0% bonds
Aggressive (High Risk Tolerance):
- 60% VOO
- 40% QQQM
- 0% bonds
FinanceSwami Recommendation: Moderate or Aggressive. You have decades to recover from downturns. Maximize growth.
Ages 31-40: Growth with Emerging Dividends
Time Horizon: 25-35 years until retirement
Risk Tolerance: High to moderate
Primary Goal: Continue aggressive growth, begin dividend foundation
Conservative:
- 70% VOO
- 20% SCHD
- 10% VYM
- 0% bonds
Moderate:
- 50% VOO
- 30% QQQM
- 20% SCHD
- 0% bonds
Aggressive:
- 40% VOO
- 40% QQQM
- 20% SCHD
- 0% bonds
FinanceSwami Recommendation: Moderate. Begin building dividend base while maintaining strong growth.
Ages 41-50: Balanced Phase
Time Horizon: 15-25 years until retirement
Risk Tolerance: Moderate
Primary Goal: Balance appreciation and income, reduce pure growth
Conservative:
- 60% VOO
- 30% SCHD
- 10% VYM
- 0% bonds
Moderate:
- 45% VOO
- 40% SCHD
- 15% VYM
- 0% bonds
Aggressive:
- 40% VOO
- 20% QQQM
- 30% SCHD
- 10% VYM
- 0% bonds
FinanceSwami Recommendation: Moderate. Shift meaningfully toward dividends while maintaining growth.
Ages 51-60: Pre-Retirement Income Building
Time Horizon: 5-15 years until retirement
Risk Tolerance: Moderate to low
Primary Goal: Generate substantial income, reduce volatility
Conservative:
- 40% VOO
- 40% SCHD
- 15% VYM
- 5% BND
- 0% QQQM
Moderate:
- 40% VOO
- 35% SCHD
- 20% VYM
- 5% JEPI
- 0% bonds
Aggressive:
- 35% VOO
- 35% SCHD
- 20% VYM
- 10% JEPI or JEPQ
- 0% bonds
FinanceSwami Recommendation: Moderate. Heavy dividend focus, begin adding covered call income if desired.
Ages 61-70: Early Retirement Phase
Time Horizon: 0-10 years until or early in retirement
Risk Tolerance: Low to moderate
Primary Goal: Live off dividends, preserve capital
Conservative:
- 30% VOO
- 40% SCHD
- 20% VYM
- 10% BND
Moderate:
- 25% VOO
- 45% SCHD
- 20% VYM
- 10% JEPI
Aggressive:
- 20% VOO
- 45% SCHD
- 20% VYM
- 15% JEPI
FinanceSwami Recommendation: Moderate. Majority in dividend-paying stocks, minimal bonds, use JEPI for income boost.
Ages 70+: Full Retirement Phase
Time Horizon: 15-25 years remaining life expectancy
Risk Tolerance: Low
Primary Goal: Reliable income, capital preservation, smooth withdrawals
Conservative:
- 20% VOO
- 40% SCHD
- 25% VYM
- 15% BND
Moderate:
- 15% VOO
- 50% SCHD
- 20% VYM
- 15% JEPI
Aggressive:
- 15% VOO
- 45% SCHD
- 25% VYM
- 15% JEPI
FinanceSwami Recommendation: Moderate. Maximum sustainable dividend income, minimal pure growth.
Complete Age-Based Allocation Table
| Age Range | Conservative | Moderate | Aggressive | Bonds |
| 22-30 | 85% VOO / 15% SCHD | 70% VOO / 30% QQQM | 60% VOO / 40% QQQM | 0% |
| 31-40 | 70% VOO / 20% SCHD / 10% VYM | 50% VOO / 30% QQQM / 20% SCHD | 40% VOO / 40% QQQM / 20% SCHD | 0% |
| 41-50 | 60% VOO / 30% SCHD / 10% VYM | 45% VOO / 40% SCHD / 15% VYM | 40% VOO / 20% QQQM / 30% SCHD / 10% VYM | 0% |
| 51-60 | 40% VOO / 40% SCHD / 15% VYM / 5% BND | 40% VOO / 35% SCHD / 20% VYM / 5% JEPI | 35% VOO / 35% SCHD / 20% VYM / 10% JEPI | 0-5% |
| 61-70 | 30% VOO / 40% SCHD / 20% VYM / 10% BND | 25% VOO / 45% SCHD / 20% VYM / 10% JEPI | 20% VOO / 45% SCHD / 20% VYM / 15% JEPI | 0-10% |
| 70+ | 20% VOO / 40% SCHD / 25% VYM / 15% BND | 15% VOO / 50% SCHD / 20% VYM / 15% JEPI | 15% VOO / 45% SCHD / 25% VYM / 15% JEPI | 0-15% |
Risk Tolerance vs. Age Matrix
Sometimes age and risk tolerance don’t align perfectly. Use this matrix to find your appropriate allocation:
Young + Low Risk Tolerance (Ages 25-35, conservative):
Problem: You’re young but hate volatility. Standard aggressive allocation will cause panic-selling.
Solution:
- 70% VOO (stable large-caps)
- 20% SCHD (dividend stability)
- 10% BND (comfort bonds)
Trade-off: You sacrifice potential returns for peace of mind. Over 30 years, might cost $200,000-$400,000 vs. aggressive allocation. But better than panic-selling during crashes.
Older + High Risk Tolerance (Ages 55-65, aggressive):
Problem: You’re older but comfortable with volatility and want growth.
Solution:
- 50% VOO (maintain meaningful growth)
- 30% SCHD (dividend foundation)
- 20% QQQM or JEPQ (growth exposure)
Trade-off: Higher volatility near retirement. If market crashes right before you retire, you might need to delay retirement 2-3 years. But potentially much higher returns.
FinanceSwami Guidance: Your allocation should reflect the more restrictive factor between age and risk tolerance. If you’re young but conservative, be conservative. If you’re older but aggressive, be moderately aggressive (not fully aggressive).
Special Situations
Late Starter (Age 45, just beginning to invest seriously):
You have 20 years until retirement but late start means aggressive growth critical.
Recommended allocation:
- 55% VOO
- 25% QQQM
- 20% SCHD
More aggressive than typical age 45 allocation because you need catch-up growth.
Early Retire (Age 50, retiring in 5 years):
You’re relatively young but retirement imminent means income focus critical.
Recommended allocation:
- 30% VOO
- 45% SCHD
- 20% VYM
- 5% JEPI
More conservative than typical age 50 because short time horizon to retirement.
Windfall Investor (Any age, inherited $500,000):
Large lump sum creates different psychology than gradual accumulation.
Recommended approach:
- Keep 12-month emergency fund separate ($30,000-$60,000)
- Dollar-cost average lump sum over 6-12 months
- Use age-appropriate allocation from tables above
- Don’t try to time the market or invest everything at once
High Income / High Savings Rate (Saving 50%+ of income):
You’re accumulating wealth rapidly and can handle more volatility.
Recommended adjustment:
- Increase QQQM allocation by 10%
- Decrease bond allocation to 0% until age 65
- Your high savings rate provides safety net, less need for conservative allocation
Allocation Adjustment Checklist
When should you adjust your allocation?
□ Every 5 years: Review and potentially shift toward next age bracket
□ Major life changes: Marriage, divorce, job loss, inheritance
□ 3-5 years before retirement: Begin significant shift toward income
□ After major market crash: Rebalance to maintain target (buy more stocks when down)
□ When allocation drifts 5%+ from target: Sell winners, buy losers to rebalance
When should you NOT adjust:
✗ Daily, weekly, or monthly market movements
✗ News headlines about crashes or rallies
✗ Friends or family recommendations
✗ Fear during downturns
✗ Greed during bull markets
Your age-appropriate allocation is decided once and adjusted gradually over decades, not constantly fiddled with based on market conditions.
10. Dangerous ETFs Beginners Should Avoid
Let me show you the types of ETFs that can seriously damage your wealth—and how to spot them before you make a costly mistake.
Danger Category #1: Leveraged ETFs (2x, 3x)
What they are: ETFs that use debt and derivatives to amplify daily returns by 2x or 3x.
Examples:
- TQQQ (ProShares UltraPro QQQ) – 3x Nasdaq-100
- UPRO (ProShares UltraPro S&P 500) – 3x S&P 500
- SOXL (Direxion Daily Semiconductor Bull 3x) – 3x semiconductors
Why they’re dangerous:
Leveraged ETFs are designed for day traders, not buy-and-hold investors. They reset daily, which creates volatility decay—you lose money even when the underlying index is flat.
Real Example of Volatility Decay:
Day 1: Index at 100, leveraged ETF at $100
Day 2: Index up 10% to 110, leveraged ETF up 30% to $130
Day 3: Index down 9.09% to 100 (back to start), leveraged ETF down 27.27% to $94.55
The index is unchanged, but you lost 5.45% due to volatility decay.
Performance Comparison (2020-2024):
| ETF | Type | 4-Year Return | Maximum Drawdown |
| QQQ | Normal Nasdaq-100 | +75% | -34% (2022) |
| TQQQ | 3x Leveraged | +125% | -79% (2022) |
TQQQ delivered higher returns but experienced a 79% crash in 2022. Most investors who held TQQQ panic-sold at the bottom and never recovered.
The math that kills you:
According to research on leveraged ETF returns, holding leveraged ETFs for more than a few days typically results in returns that are far less than 2x or 3x the underlying index due to compounding effects and daily resets. Over 5+ year periods, many leveraged ETFs have underperformed 1x index funds despite being marketed as 3x returns.
FinanceSwami rule: Never buy leveraged ETFs. Ever. They’re designed for professional day traders, not long-term investors.
Danger Category #2: Inverse ETFs (Short/Bear)
What they are: ETFs that go up when the market goes down—essentially betting against stocks.
Examples:
- SQQQ (ProShares UltraPro Short QQQ) – Inverse 3x Nasdaq
- SH (ProShares Short S&P 500) – Inverse S&P 500
- DOG (ProShares Short Dow 30) – Inverse Dow Jones
Why they’re dangerous:
Stock markets go up over time (~75% of years are positive). Inverse ETFs are guaranteed long-term losers.
Historical Performance:
| Year | S&P 500 | SH (Inverse S&P 500) |
| 2019 | +31% | -27% |
| 2020 | +18% | -15% |
| 2021 | +29% | -24% |
| 2022 | -18% | +21% (only winning year) |
| 2023 | +26% | -22% |
| 5-Year Total | +100% | -62% |
SH won in 1 out of 5 years and lost 62% cumulatively while the market doubled.
When investors buy inverse ETFs:
Typically during market panic: “The market is crashing, I’ll buy SQQQ to profit from the decline!” By the time you’re convinced to buy, the crash is usually near the bottom. Then the market recovers and your inverse ETF crashes.
FinanceSwami rule: Never buy inverse ETFs. If you’re scared of a crash, just hold cash or bonds—don’t bet against the market.
Danger Category #3: Sector-Specific ETFs (Narrow Focus)
What they are: ETFs focused on a single industry or sector.
Examples:
- XLE (Energy sector)
- XLF (Financial sector)
- XLK (Technology sector)
- ARKK (ARK Innovation – thematic tech)
Why they’re risky:
Sectors go through extreme boom-bust cycles. Timing is everything, and beginners almost always buy at peaks.
Real Example: ARKK (ARK Innovation ETF)
Cathie Wood’s famous innovation fund became extremely popular in 2020-2021:
| Date | ARKK Price | Performance |
| March 2020 | $33 | Start of COVID recovery |
| February 2021 | $156 | Peak (+373%) |
| December 2022 | $35 | Crash (-78% from peak) |
| January 2026 | $45 | Still down 71% from peak |
Most investors bought ARKK in late 2020 or 2021 after seeing the spectacular gains. They bought near $120-$150 and are still down 60-70% five years later.
Sector Performance Volatility (2000-2023):
| Decade | Best Performing Sector | Worst Performing Sector |
| 2000-2010 | Energy (+180%) | Technology (-40%) |
| 2010-2020 | Technology (+380%) | Energy (-25%) |
The best-performing sector of one decade became the worst of the next. Timing sectors is nearly impossible.
FinanceSwami rule: Avoid sector ETFs. Use broad market ETFs (VOO, VTI) that own all sectors automatically. If you must use sectors, limit to 5-10% of portfolio maximum.
Danger Category #4: Thematic/Fad ETFs
What they are: ETFs built around trendy themes or investment fads.
Examples:
- Robotics ETFs
- Genomics ETFs
- Blockchain ETFs
- Cloud computing ETFs
- Marijuana ETFs
- Space exploration ETFs
- Metaverse ETFs
Why they’re dangerous:
By the time a theme is popular enough to have an ETF, it’s usually late in the hype cycle. These ETFs typically:
- Launch near market peaks
- Charge high fees (0.50-0.75%)
- Have low assets (under $500M)
- Close within 3-5 years when theme fades
- Underperform broad market
Real Example: Blockchain/Crypto ETFs (2021-2022)
Dozens of blockchain ETFs launched in 2021 during crypto mania:
- Most launched with $20-$100M in assets
- Charged 0.65-0.95% expense ratios
- Dropped 60-80% in 2022 crypto crash
- Many have since closed, forcing taxable liquidations
- Survivors still underwater 70-80% from launch
Thematic ETF Failure Rate:
According to Morningstar research analyzing ETF closures:
- 50% of thematic ETFs close within 5 years
- 80% underperform S&P 500 over their lifetime
- Average lifespan: 3.2 years
FinanceSwami rule: Avoid thematic ETFs entirely. They’re marketing products designed to capture investor excitement, not long-term wealth builders.
Danger Category #5: High-Expense Actively Managed ETFs
What they are: ETFs where a manager picks stocks instead of tracking an index.
Examples:
- Many actively managed funds with 0.75-1.50% expense ratios
- “Smart beta” funds with complex strategies
- Funds marketed as “beating the market”
Why they’re expensive and underperforming:
Performance Reality:
According to SPIVA (S&P Indices Versus Active) research:
- 92% of active managers underperform the S&P 500 over 15 years
- After fees, only 2-5% consistently outperform
- Past performance doesn’t predict future performance
Cost Comparison Over 30 Years ($100,000 initial, $1,000/month):
| Fund Type | Expense Ratio | Final Value | Fees Paid | vs. Index |
| Index ETF | 0.03% | $2,438,000 | $31,000 | Baseline |
| Active ETF | 0.75% | $2,087,000 | $382,000 | -$351,000 |
| Expensive Active | 1.50% | $1,811,000 | $658,000 | -$627,000 |
The expensive active fund costs you $627,000 in fees and underperformance over 30 years.
FinanceSwami rule: Avoid actively managed ETFs charging over 0.20%. Use passive index ETFs instead. The only exceptions are specialized strategies like JEPI’s covered calls (0.35%), where the strategy justifies the cost.
Danger Category #6: Low-Asset / Recently Launched ETFs
What they are: New or unpopular ETFs with under $500M in assets.
Why they’re risky:
Closure risk: ETFs with low assets often close, forcing you to:
- Sell at an inopportune time
- Realize taxable capital gains
- Find replacement ETF
- Pay transaction costs
ETF Closure Statistics:
| Assets Under Management | Annual Closure Rate |
| Under $50M | 15-20% annually |
| $50M-$250M | 5-10% annually |
| $250M-$500M | 2-5% annually |
| Over $1B | Under 1% annually |
Real Example: Dozens of Clean Energy ETFs (2020-2024)
15+ clean energy ETFs launched in 2020-2021 during ESG boom. By 2024:
- 8 had closed (forced liquidations)
- 4 had under $100M in assets (at risk)
- Only 3 had over $500M (stable)
FinanceSwami rule: Only buy ETFs with $1B+ in assets for core holdings. You can use $500M+ ETFs for specialized needs, but never use ETFs under $100M.
Danger Category #7: Complex Strategy ETFs
What they are: ETFs using complicated strategies involving options, futures, or derivatives.
Examples (besides covered calls):
- Currency-hedged ETFs
- Volatility ETFs (VXX, UVXY)
- Futures-based commodity ETFs
- Multi-factor smart beta ETFs
Why they’re confusing and risky:
Most investors don’t understand how these work, leading to:
- Unexpected behavior during crashes
- Hidden costs in derivative strategies
- Tax complexity
- Counterparty risk
Real Example: VXX (Volatility ETF)
Designed to profit from market volatility/fear. In practice:
- Loses money 80-90% of the time (markets usually calm)
- Down 99.9% since launch in 2009
- Regularly reverse-splits to avoid delisting
- Only profitable during extreme panic
FinanceSwami rule: Avoid complex strategy ETFs unless you fully understand the mechanics. For beginners, stick to simple index tracking.
The “Red Flag” Checklist
Before buying any ETF, check for these warning signs:
□ “2X” or “3X” in name → Leveraged, avoid
□ “Inverse” or “Short” in name → Betting against market, avoid
□ Launched in past 2 years → Unproven, high risk
□ Assets under $500M → Closure risk
□ Expense ratio over 0.50% → Too expensive (unless JEPI/JEPQ covered calls)
□ Focuses on single sector → Too concentrated
□ Based on trendy theme → Probably a fad
□ Complex strategy you don’t understand → Too risky
□ Heavily marketed with big claims → Usually underperforms
If you see 2+ red flags, don’t buy.
Safe Alternatives to Dangerous ETFs
Instead of risky choices, use proven alternatives:
| Dangerous ETF | Why It’s Bad | Safe Alternative |
| TQQQ (3x Nasdaq) | Leveraged, volatility decay | QQQM (1x Nasdaq) |
| SQQQ (Inverse) | Bets against market | BND (Bonds for safety) |
| ARKK (Innovation theme) | Concentrated, fad | VOO (Broad market) |
| XLE (Energy sector) | Single sector volatility | VOO (All sectors) |
| Blockchain ETFs | Fad theme, high fees | QQQM (Tech exposure) |
| Active stock picker | High fees, underperforms | VOO or VTI (Index) |
| Small cap launched 2023 | Closure risk | VOO (Established) |
The pattern is clear: When in doubt, use VOO, VTI, or one of the 8 core ETFs I recommended earlier.
11. How to Buy Your First ETF (Step by Step)
Let me walk you through the exact process of buying your first ETF, from opening an account to placing your first order.
Step 1: Choose a Brokerage (5 minutes)
Pick one of the three best brokerages for beginners:
Fidelity (Best for beginners):
- Excellent customer service (24/7 phone support)
- Best mobile app
- Great research tools
- Zero minimums, zero commissions
- Go to: fidelity.com
Vanguard (Best for low-cost purists):
- Invented index fund investing
- Company owned by fund shareholders
- Rock-bottom fees
- Zero minimums, zero commissions
- Go to: vanguard.com
Schwab (Best for integrated banking):
- Great app and service
- Checking account integration
- ATM fee reimbursement
- Zero minimums, zero commissions
- Go to: schwab.com
All three are excellent. Pick whichever appeals to you most. You can’t go wrong.
Step 2: Open a Roth IRA (15-20 minutes)
Why Roth IRA first?
According to the FinanceSwami Ironclad Investment Strategy Framework, after getting your 401(k) match, Roth IRA should be your next priority. Tax-free growth forever is incredibly powerful.
Opening a Roth IRA at Fidelity (example):
- Go to fidelity.com
- Click “Open an Account”
- Select “Retirement” → “Roth IRA”
- Click “Continue”
Information you’ll need:
- Full legal name
- Home address
- Date of birth
- Social Security number
- Employment information (employer name, occupation, annual income)
- Beneficiary (who inherits the account if you die)
Time required: 15-20 minutes
Account limits (2026):
- Under 50: $7,000/year maximum
- 50+: $8,000/year maximum
Once submitted, approval is usually immediate.
Step 3: Fund Your Account (2-5 business days)
Link your bank account:
- Navigate to “Transfers” or “Move Money”
- Select “Link External Bank Account”
- Enter your bank’s routing number (9 digits) and account number
- Verify ownership: Brokerage deposits $0.23 and $0.47 to confirm
- Wait 2-3 business days for verification
- Confirm the micro-deposit amounts
Transfer initial money:
After verification complete, transfer your starting amount:
- Minimum: $500 (feels real, meaningful)
- Comfortable: $1,000-$3,000
- Ideal: $5,000-$7,000
How to transfer:
- Click “Transfer Money”
- From: Your linked bank account
- To: Your Roth IRA
- Amount: $___
- Submit
Money typically arrives same day or next business day.
Step 4: Buy Your First ETF (5 minutes)
Now comes the actual investing. Let’s buy VOO as an example.
Placing an ETF Order (Fidelity example):
- Log into your account
- Navigate to trading:
- Click “Accounts & Trade”
- Select your Roth IRA
- Click “Trade” → “Stocks/ETFs”
- Enter the ticker symbol:
- In search box, type: VOO
- Verify: “Vanguard S&P 500 ETF” appears
- Expense ratio should show: 0.03%
- Click “Trade”
- Select action:
- Action: Buy
- Choose order type:
Market Order (Recommended for beginners):
- Buys immediately at current market price
- Executes within seconds during market hours
- Use this for your first purchase
Limit Order (Advanced):
- You specify maximum price you’ll pay
- Order only executes if price reaches your limit
- May not execute if price never hits your limit
- Skip this as beginner
- Enter quantity:
You have two options:
Option A: Dollar Amount (Easier for beginners):
- If you have $1,000 and want 70% in VOO
- Enter: $700 in the “Dollar amount” field
- Brokerage will buy as many shares as possible (including fractional)
Option B: Number of Shares:
- If VOO is trading at $450/share
- And you have $700 to invest
- Enter: 1.5 shares (or just 1 share if fractional not available)
Most brokerages allow fractional shares. Use dollar amount method—it’s simpler.
- Review order:
- ETF: VOO (Vanguard S&P 500 ETF)
- Action: Buy
- Amount: $700 (or X shares)
- Order type: Market
- Account: Roth IRA
- Estimated cost: $700
- Submit order
Confirmation appears immediately. During market hours (9:30 AM – 4:00 PM Eastern, Monday-Friday), order executes within seconds.
You now own VOO! You own fractional pieces of the 500 largest U.S. companies.
Step 5: Buy Your Second ETF (5 minutes)
If following the FinanceSwami Framework two-ETF portfolio (70% VOO / 30% QQQM), repeat the process for QQQM:
- Navigate to “Trade” → “Stocks/ETFs”
- Enter ticker: QQQM
- Verify: “Invesco Nasdaq-100 ETF” (Expense ratio: 0.15%)
- Action: Buy
- Order type: Market
- Amount: $300 (if you started with $1,000 total)
- Review and submit
You now have a complete portfolio: 70% VOO + 30% QQQM.
Step 6: Set Up Automatic Investing (10 minutes) — CRITICAL
This is the most important step. Automation ensures you keep investing consistently without thinking about it.
Setting up automatic contributions:
- Navigate to automatic transfers:
- Go to “Transfers” → “Automatic Transfers”
- Or “Automatic Investments”
- Configure recurring transfer:
- From: Your linked checking account
- To: Your Roth IRA
- Amount: $583/month (to max $7,000 annual limit)
- Or whatever you can afford: $300, $500, $1,000/month
- Frequency: Monthly
- Day of month: 1st (or day after your paycheck)
- Start date: Next month
- Configure automatic investment:
- Some brokerages allow you to automatically invest incoming cash
- Set: 70% to VOO, 30% to QQQM
- Or manually invest once per month when money arrives
- Save and activate
Now it’s completely automated:
- Every month: Money transfers from checking to Roth IRA automatically
- Same day: Money automatically invests into VOO (70%) and QQQM (30%)
- You never think about it
This automation is how wealth gets built. Set it and forget it.
Step 7: Enroll in 401(k) if Available (20 minutes)
If your employer offers a 401(k), enroll separately:
- Contact HR or log into benefits portal
- Enroll in 401(k) plan
- Set contribution percentage:
- Minimum: Enough to get full match (often 6%)
- Target: 10-15% of gross salary
- Maximum: $23,500/year ($31,000 if 50+)
- Select investments:
- Look for lowest-cost S&P 500 index fund
- Names like: “S&P 500 Index,” “500 Index Fund,” “Large Cap Index”
- Or choose target-date fund matching your retirement year
- Save changes
Complete Purchase Checklist
Use this to verify you’ve completed everything:
□ Chose brokerage (Fidelity, Vanguard, or Schwab)
□ Opened Roth IRA (15 minutes)
□ Linked bank account (2-3 day verification)
□ Transferred initial money (same/next day arrival)
□ Bought first ETF (VOO or VTI)
□ Bought second ETF if using two-fund (QQQM or SCHD)
□ Set up automatic monthly transfers ($583/month or affordable amount)
□ Set up automatic investments (same 70/30 allocation)
□ Enrolled in 401(k) if available (at least to match)
□ Set annual review reminder (December 31st each year)
Once this checklist is complete, you’re done. You have a fully automated investment system that will build wealth for decades.
Common Purchase Questions
Q: What if I can’t afford $1,000 to start?
Start with whatever you have—$100, $200, $500. Most brokerages have $0 minimums. Buy fractional shares with your available amount, then set up automatic $100-$300/month contributions.
Q: Should I wait for a market dip before buying?
No. Research shows that lump-sum investing beats dollar-cost averaging 66% of the time because markets go up more than they go down. If you have money ready, invest it today. Don’t try to time the market.
Q: What if the market crashes right after I buy?
Keep your automatic contributions going. You’ll be buying more shares at lower prices. This is ideal for long-term wealth building. Every crash in history has been followed by recovery to new highs.
Q: Can I buy ETFs in my regular checking account?
Technically yes (taxable brokerage account), but this is tax-inefficient. Always max Roth IRA ($7,000/year) and 401(k) before using taxable accounts. Tax-advantaged accounts save you hundreds of thousands in taxes over decades.
Q: Do I need to buy whole shares?
No. Fidelity and Schwab allow fractional shares for ETFs. Vanguard allows fractional shares for mutual funds but not ETFs. If your brokerage doesn’t support fractional ETF shares, buy as many whole shares as possible and reinvest the remainder next month.
Q: When should I place my order?
Market hours are 9:30 AM – 4:00 PM Eastern, Monday-Friday. Place market orders anytime during these hours. Don’t obsess over exact timing—just buy when convenient. Over decades, the difference between buying at 10 AM vs. 2 PM is meaningless.
First Purchase Timeline
Week 1:
- Monday: Open Roth IRA (15 minutes)
- Monday: Link bank account (5 minutes)
- Wednesday-Thursday: Account verified (wait 2-3 days)
Week 2:
- Monday: Transfer initial investment ($500-$5,000)
- Tuesday: Money arrives in Roth IRA
- Tuesday: Buy VOO + QQQM (10 minutes total)
- Tuesday: Set up automatic monthly contributions (10 minutes)
Week 3:
- Monday: Enroll in 401(k) if available (20 minutes)
- Monday: Select 401(k) investments (10 minutes)
Week 4:
- Set December 31st annual review reminder
- Relax—you’re done
- Don’t check account for 3-6 months
Total active time: 1.5-2 hours spread over 2-3 weeks
That’s it. In less than 2 hours of total work, you’ve built a complete, automated investment system that will compound wealth for 30-40 years.
12. Common Mistakes When Choosing ETFs
Let me show you the mistakes I see beginners make repeatedly—and how to avoid them.
Mistake #1: Paralysis by Analysis (Cost: Months or Years of Missed Returns)
The mistake: Spending weeks or months researching which ETF is “perfect,” reading countless articles, comparing tiny differences, and never actually investing.
Real cost:
If you delay 6 months while researching:
- $500/month for 30 years = $1,028,000
- Missing first 6 months = $3,000 not invested
- That $3,000 would grow to $52,000 over 30 years
Delaying 6 months costs you $52,000.
Why it happens:
There are 3,000+ ETFs. Every article recommends something different. You want to make the “perfect” choice. But the difference between VOO, VTI, IVV, and FXAIX is negligible (0-0.02% annually).
The fix:
Give yourself 1 week maximum to choose. Pick from the 8 core ETFs I recommended. They’re all excellent. The most important decision is investing, not which exact ETF.
Use this decision tree:
Want simple? → Buy VOO (or VTI)
Under 40 and want growth? → Buy 70% VOO + 30% QQQM
Over 40 and want income? → Buy 50% VOO + 30% SCHD + 20% VYM
Done. Move on with your life.
Mistake #2: Chasing Past Performance (Cost: 20-40% Underperformance)
The mistake: Buying whatever ETF had the best returns last year, assuming it will continue.
Why it backfires:
Mean reversion: Assets that dramatically outperform often underperform next. Assets that underperform often outperform next. This is called mean reversion.
Real Example: ARK Innovation ETF (ARKK)
| Period | Performance | What Investors Did |
| 2020 | +157% | Small investor interest |
| 2021 (Jan-Feb) | +50% more | Massive inflows, peak popularity |
| 2021 (Mar-Dec) | -40% decline begins | Most investors bought near peak |
| 2022 | -67% | Panic selling, massive outflows |
| 2023-2024 | Mediocre recovery | Still down 70% from peak |
According to Morningstar analyzing cash flows, investors poured $10B into ARKK in late 2020 and early 2021 when it was most expensive. Average investor in ARKK lost 40-50% while the fund itself (from inception) was up modestly.
Performance chasing pattern:
- ETF has great year (people ignore it)
- ETF has second great year (people start noticing)
- ETF has third great year (massive buying, peak popularity)
- ETF crashes or underperforms (people bought at peak)
The fix:
Never buy an ETF because it had the best returns recently. Buy based on:
- Broad diversification
- Low costs
- Long-term track record (10+ years, not 1-2 years)
- Fits your age-appropriate allocation
If an ETF is being heavily marketed and everyone is talking about it, it’s probably too late.
Mistake #3: Over-Diversification (Cost: Complexity + Underperformance)
The mistake: Buying 10-15+ different ETFs thinking “more diversification = less risk.”
Why it backfires:
After 5-7 ETFs, you’re not adding meaningful diversification—you’re adding complexity and likely adding overlapping holdings that create unintended concentrations.
Real Example: Over-Diversified Portfolio
Beginner buys:
- VOO (S&P 500)
- VTI (Total Market)
- IVV (S&P 500, different provider)
- SCHD (Dividend stocks)
- VYM (Dividend stocks)
- QQQM (Nasdaq-100)
- VGT (Technology sector)
- XLK (Technology sector, different provider)
- VUG (Growth stocks)
- IJH (Mid-cap)
Problems:
- VOO, VTI, and IVV are 80-90% the same companies (duplication)
- SCHD and VYM have 50-60% overlap
- QQQM, VGT, and XLK all heavily overlap (Apple, Microsoft, Google in all three)
- VUG is 70% the same as QQQM
- Total portfolio has 30% of assets in just 5 companies due to overlaps
The result: 10 ETFs, but effective diversification is no better than holding 3-4 ETFs. Plus annual rebalancing requires 10 trades instead of 3.
The fix:
Follow the FinanceSwami rule: 2-5 core holdings maximum.
- Under 40: 2 ETFs (VOO + QQQM)
- Ages 40-55: 3 ETFs (VOO + SCHD + VYM or QQQM)
- Ages 55+: 4-5 ETFs (VOO + SCHD + VYM + JEPI + optional BND)
More than 5 holdings is usually unnecessary complexity.
Mistake #4: Buying Too Many Similar ETFs (Cost: Duplication + Fees)
The mistake: Buying multiple ETFs that track similar or overlapping indexes.
Common duplications:
| First ETF | Second ETF | Overlap |
| VOO (S&P 500) | IVV (S&P 500) | 100% identical |
| VOO (S&P 500) | VTI (Total Market) | 82% overlap |
| SCHD (Dividend) | VYM (Dividend) | 50-60% overlap |
| QQQ (Nasdaq-100) | QQQM (Nasdaq-100) | 100% identical |
| VGT (Tech sector) | QQQM (Nasdaq-100) | 70-80% overlap |
The fix:
Pick ONE from each category:
- Broad market: VOO or VTI (not both)
- Growth: QQQM (not QQQ and QQQM)
- Dividend: SCHD or VYM (both is okay, but one is sufficient)
- Income: JEPI or JEPQ (not both)
Mistake #5: Ignoring Expense Ratios (Cost: $100,000-$400,000)
The mistake: Buying ETFs without checking expense ratios, assuming “all ETFs are cheap.”
Why it matters:
We covered this earlier, but it bears repeating: A 1% expense ratio difference costs $400,000+ over 30 years on a $500,000 portfolio.
Comparison of real ETFs tracking S&P 500:
| ETF | Expense Ratio | Cost on $100,000 | 30-Year Cost |
| FXAIX | 0.015% | $15/year | $10,000 |
| VOO | 0.03% | $30/year | $20,000 |
| SPY | 0.09% | $90/year | $62,000 |
| Active fund | 1.00% | $1,000/year | $400,000+ |
All track the same index. Why pay 10x-100x more for identical holdings?
The fix:
Never pay more than 0.20% for an ETF unless it’s a specialized strategy like JEPI/JEPQ covered calls (0.35%).
Before buying, always check: “What’s the expense ratio?” If above 0.20%, find a cheaper alternative.
Mistake #6: Panic-Selling During Crashes (Cost: 30-50% Permanent Loss)
The mistake: Selling ETFs during market downturns to “stop the bleeding” or “preserve capital.”
Why it’s devastating:
You lock in losses permanently. Markets recover. Selling doesn’t.
Real Example: 2020 COVID Crash
| Investor Type | Action | Outcome |
| Panic Seller | Sold VOO at $220 in March 2020 | Locked in 30% loss, sat in cash, missed recovery |
| Buy-and-Hold | Held VOO through crash | Back to even by August 2020, up 80% by end 2021 |
| Opportunistic | Bought more VOO at $220 | Gained 100%+ on March purchases |
According to Dalbar investor behavior studies, the average investor earns 3-5% less annually than buy-and-hold investors primarily due to panic-selling during downturns.
The fix:
Never sell ETFs during crashes. Period.
- Build 12-month emergency fund before investing (FinanceSwami Ironclad Framework Step 1)
- Choose allocation you can stick with through -30% crashes
- Don’t check account during market turmoil
- Keep automatic contributions going (buy more at discount)
- Remember: Every crash in history recovered
Mistake #7: Not Reinvesting Dividends (Cost: $200,000+)
The mistake: Taking dividend payments as cash instead of automatically reinvesting to buy more shares.
Cost of not reinvesting:
$100,000 in SCHD (3.5% dividend yield) over 30 years:
| Strategy | Final Value | Difference |
| Reinvest dividends | $942,000 | Baseline |
| Take dividends as cash | $612,000 | -$330,000 |
Not reinvesting costs $330,000 in lost compounding.
The fix:
Always reinvest dividends until retirement. Every brokerage offers automatic dividend reinvestment (DRIP). Turn it on for all ETFs.
When you retire and need income, then turn off reinvestment and take dividends as cash.
Mistake #8: Trying to Time the Market (Cost: Missing Best Days)
The mistake: Waiting for the “right time” to invest, trying to buy at dips, selling before crashes.
Why it fails:
The best market days often occur during volatile periods. If you’re out of the market waiting for “stability,” you miss the best days.
Missing Best Days (1993-2022):
| Strategy | 30-Year Return | $10,000 Becomes |
| Stayed invested all 7,500 days | 9.8% annually | $170,000 |
| Missed 10 best days | 6.1% annually | $61,000 |
| Missed 30 best days | 2.8% annually | $23,000 |
Missing just 10 days out of 7,500 (0.13% of days) cuts your wealth by 64%.
The problem: Those 10 best days are impossible to predict. Six of the 10 best days occurred within 2 weeks of the 10 worst days.
The fix:
Stay invested always. Use dollar-cost averaging if nervous about lump sums, but don’t try to time entries and exits. Time in market beats timing the market.
Mistake #9: Checking Portfolio Too Often (Cost: Bad Decisions)
The mistake: Checking portfolio daily or weekly, reacting to short-term movements.
Why it hurts:
Research shows investors who check portfolios daily earn 3-5% less annually than those who check quarterly or annually. Why? They make emotional decisions based on recent volatility.
Daily checking leads to:
- Panic-selling during drops
- Greed-buying during surges
- Constant tinkering with allocation
- Increased trading (taxes and costs)
- Higher stress and anxiety
The fix:
Check portfolio once per year on December 31st. That’s it.
Set a calendar reminder. On December 31st:
- Log in
- Check if allocation drifted 5%+ from target
- Rebalance if needed (15 minutes)
- Log out
- Ignore for another year
Mistake #10: Not Having a Written Plan (Cost: Inconsistency)
The mistake: Investing without clear targets, allocation strategy, or decision framework.
Why it fails:
Without a plan, you:
- Change strategy constantly based on news
- Second-guess decisions
- Get swayed by hot tips
- Never know if you’re on track
- Make emotional decisions
The fix:
Write down your investment plan.
Use this template:
My Investment Plan
- Current age: _______
- Target retirement age: _______
- Current portfolio: $_______
- Monthly contribution: $_______
- Target allocation:
- VOO: _____%
- QQQM: _____%
- SCHD: _____%
- Other: _____%
- Review schedule: December 31st annually
- Rebalance trigger: 5% drift from target
- Next allocation shift: Age _____ (5 years from now)
Emergency rules:
- Never sell during crashes
- Never stop automatic contributions
- Never chase performance
- Never buy leveraged or inverse ETFs
Print this. Keep it. Follow it.
The Bottom Line on Avoiding Mistakes
Most ETF mistakes aren’t about picking the wrong fund. They’re about:
- Delaying too long (just start)
- Chasing performance (ignore recent returns)
- Over-complicating (keep it simple)
- Panic-selling (stay invested)
- Not automating (set it and forget it)
The winning strategy:
- Pick 2-4 core ETFs from my recommendations
- Invest immediately
- Automate monthly contributions
- Reinvest dividends
- Check once per year
- Never sell during crashes
- Follow your written plan
Do these 7 things and you’ll beat 90% of investors—including professionals.
13. How to Track and Maintain Your ETF Portfolio
Let me show you the minimal-effort system for tracking and maintaining your portfolio over decades.
The Annual Review System (Once Per Year)
When: December 31st every year
Time required: 30 minutes
Frequency: Once annually (never more)
What you check:
1. Current allocation vs. target
Log into your brokerage and check current percentages:
Example Review:
| ETF | Target % | Current $ | Current % | Drift | Action Needed |
| VOO | 50% | $52,000 | 52% | +2% | None (within 5%) |
| SCHD | 30% | $32,000 | 32% | +2% | None |
| VYM | 20% | $16,000 | 16% | -4% | None |
| Total | 100% | $100,000 | 100% | No rebalancing needed |
Rebalance only if any position drifted 5%+ from target.
Example requiring rebalancing:
| ETF | Target % | Current $ | Current % | Drift | Action |
| VOO | 50% | $58,000 | 58% | +8% | Sell $8,000 |
| SCHD | 30% | $28,000 | 28% | -2% | Buy $2,000 |
| VYM | 20% | $14,000 | 14% | -6% | Buy $6,000 |
Sell $8,000 of VOO, buy $2,000 SCHD and $6,000 VYM to restore 50/30/20 target.
2. Total portfolio value and growth
- Portfolio value today: $_______
- Portfolio value last year: $_______
- Growth: $_______ (______%)
- Total contributions this year: $_______
- Investment gains: $_______ (portfolio growth minus contributions)
3. Dividend income generated
- Total dividends received this year: $_______
- Dividend growth vs. last year: ______%
- Projected annual dividend (current yield × portfolio): $_______
4. Contribution rate check
- Did you max Roth IRA? ($7,000 for 2024)
- Did you max 401(k) match?
- Can you increase monthly contribution by 5-10% next year?
5. Age-appropriate allocation check
Every 5 years, verify your allocation still matches your age:
- Did you turn 40? → Reduce QQQM, increase SCHD
- Did you turn 50? → Shift more to dividends
- Did you turn 60? → Consider adding JEPI
- Did you turn 65? → Maximum dividend focus
That’s it. 30 minutes once per year.
The Simple Tracking Spreadsheet
You don’t need fancy software. A simple spreadsheet works perfectly.
Annual Portfolio Tracking Template:
| Year | Age | Portfolio Value | Annual Contribution | Investment Gains | Total Dividends | % Return |
| 2026 | 35 | $52,000 | $10,000 | $5,000 | $800 | 10.6% |
| 2027 | 36 | $68,000 | $11,000 | $7,000 | $1,100 | 11.5% |
| 2028 | 37 | $85,000 | $11,500 | $9,500 | $1,450 | 12.3% |
Track once per year on December 31st. Over decades, you’ll see the compounding magic happen.
When to Rebalance (The 5% Rule)
Rebalance only when allocation drifts 5%+ from target.
Example:
Your target: 50% VOO / 30% SCHD / 20% VYM
After a year where VOO surged:
- VOO is now 56% (drift: +6%) → Rebalance needed
- SCHD is now 27% (drift: -3%) → Within tolerance
- VYM is now 17% (drift: -3%) → Within tolerance
How to rebalance:
Sell $6,000 of VOO (brings it from 56% to 50%)
Buy $3,000 SCHD (brings it from 27% to 30%)
Buy $3,000 VYM (brings it from 17% to 20%)
Why the 5% rule:
- Prevents over-trading (taxes and transaction costs)
- Allows winners to run somewhat
- Forces “sell high, buy low” discipline
- Minimal effort (most years no rebalancing needed)
In tax-advantaged accounts (IRA, 401k): Rebalance freely, no tax consequences
In taxable accounts: Rebalancing creates taxable events. Consider:
- Using new contributions to buy underweight assets (avoids selling)
- Tax-loss harvesting when rebalancing (offset gains with losses)
- Tolerating slightly larger drifts (7-8%) to avoid frequent taxable sales
Portfolio Health Indicators
Green flags (portfolio is healthy):
✓ Allocation within 5% of target
✓ All ETFs have expense ratios under 0.20% (except JEPI/JEPQ at 0.35%)
✓ All ETFs have $1B+ in assets
✓ Dividend income growing 5-10% annually
✓ Total returns roughly match market benchmarks
✓ You haven’t sold anything in past year (stayed disciplined)
✓ Automatic contributions still running
Red flags (needs attention):
✗ Allocation drifted 10%+ from target → Rebalance
✗ You stopped automatic contributions → Restart immediately
✗ You sold during market downturn → Recommit to staying invested
✗ You added 5+ new ETFs in past year → Over-complicating, consolidate
✗ Total returns dramatically different from benchmarks → Check if ETF holdings changed
✗ One ETF dropped to under $500M assets → Consider replacing with larger fund
Allocation Shift Timeline
Don’t shift allocation suddenly. Adjust gradually over 2-3 years when crossing age thresholds.
Example: Shifting at Age 40
Target shift: From 70% VOO / 30% QQQM → 50% VOO / 30% SCHD / 20% QQQM
Year 1 (age 39-40): 60% VOO / 25% QQQM / 15% SCHD
Year 2 (age 40-41): 55% VOO / 22% QQQM / 23% SCHD
Year 3 (age 41-42): 50% VOO / 20% QQQM / 30% SCHD
Use new monthly contributions to buy the underweight positions (SCHD in this case). Sell QQQM gradually only if necessary.
This gradual shift:
- Avoids market timing risk (don’t sell everything on one day)
- Minimizes tax impact in taxable accounts
- Feels less dramatic psychologically
- Allows you to adjust if circumstances change
What NOT to Track
Don’t waste time tracking:
✗ Daily/weekly/monthly price movements
✗ Individual stock holdings within ETFs
✗ Exact purchase prices (cost basis matters only for taxes)
✗ Intraday highs and lows
✗ Trading volume
✗ Analyst ratings or recommendations
✗ News about individual companies in your ETFs
Why? None of these affect your long-term strategy. Checking them wastes time and encourages bad decisions.
The Maintenance Calendar
January 1st: Review last year’s performance (from December 31st check), set goals for new year
February-November: Do nothing. Live your life. Automatic contributions keep running.
December 31st:
- 30-minute annual review
- Check allocation drift
- Rebalance if needed
- Adjust monthly contributions if income changed
- Plan allocation shift if approaching age milestone (40, 50, 60)
Every 5 years (ages ending in 0 or 5):
- Major allocation review
- Shift toward next life stage
- Verify FinanceSwami age-appropriate allocation
At retirement (age 65):
- Final major allocation shift to income focus
- Turn off dividend reinvestment
- Start taking dividends as cash
- Set up withdrawal strategy
That’s the complete maintenance system. Twelve months of the year, you do nothing. Once per year, you spend 30 minutes. Every 5 years, you shift allocation gradually.
14. When You’re Ready to Invest: Practical Next Steps
I want to address the mental barrier that stops many people from actually taking action. You’ve read this entire guide. You understand ETFs. You know the strategy. But you still haven’t opened that brokerage account and made your first purchase.
Let me be direct: the knowledge is worthless without implementation. If you want to invest but keep delaying, you’re costing yourself real money—not theoretical money, actual wealth that won’t exist because of hesitation.
Here’s what I want you to do this week. Not “someday.” This week.
Step 1: Choose your online broker
Go to Fidelity.com, Vanguard.com, or Schwab.com. Pick one. They’re all excellent. Don’t overthink this decision—you’re not getting married to the platform, you’re opening an account. Takes 15 minutes.
Step 2: Open a Roth IRA
Click “Open an Account,” select “Roth IRA,” and fill out the application. You’ll need your Social Security number, employment information, and bank account details. The process is straightforward and guided.
Step 3: Fund the account
Link your bank account and transfer money. Start with whatever you have—$500, $1,000, $5,000. The amount matters less than starting. You can always add more later.
Step 4: Buy your first ETFs
Based on your age, buy the appropriate ETFs from the portfolios outlined in this guide:
- Young (under 40): 70% VOO, 30% QQQM
- Mid-career (40-55): 50% VOO, 35% SCHD, 15% VYM
- Pre-retirement (55-65): 40% VOO, 40% SCHD, 20% VYM
Place your order. It executes in seconds. Congratulations—you’re now an investor.
Step 5: Set up automatic monthly contributions
This is the most important step. Set up automatic transfers from your bank account to your investment account every month. $200, $500, $1,000—whatever fits your budget. Set it up once and never think about it again.
Step 6: Turn on automatic dividend reinvestment
In your account settings, enable DRIP (Dividend Reinvestment Plan). This ensures any dividends your ETFs generate automatically buy more shares instead of sitting as cash.
Step 7: Set one annual reminder
Create a calendar reminder for December 31st every year to check your portfolio allocation. That’s your only maintenance task—30 minutes once per year.
That’s the complete implementation. Seven steps. Probably takes two hours total, including account setup, funding, and purchase. Two hours this week will set up decades of wealth building.
The etfs come with decades of proven performance. The strategy is time-tested. The costs are minimal. The tax advantages are built in. Every ingredient for success is ready and waiting.
All that’s missing is your decision to start.
Ten years from now, you’ll either have a substantial investment portfolio generating passive income, or you’ll wish you had started today. That decision is being made right now, in this moment, as you read these words.
Don’t be the person who understands investing but never invests. Start with ETFs this week. Your future self will thank you.
15. Practical ETF Selection Tools and Checklists
Let me give you practical tools and checklists you can use to select, track, and maintain your ETF portfolio.
ETF Evaluation Checklist
Use this checklist before buying any ETF:
Basic Safety Check:
□ Assets over $1B? (Yes = proceed, No = avoid)
□ Expense ratio under 0.20%? (Yes = good, 0.20-0.35% = acceptable for specialized, over 0.35% = avoid)
□ At least 100+ holdings? (Yes = diversified, No = concentrated)
□ Established provider? (Vanguard, Fidelity, Schwab, BlackRock, Invesco = yes)
□ 3+ year track record? (Yes = proven, No = wait)
□ Passive index tracking or dividend focus? (Yes = simple, No = complex)
Advanced Check:
□ Holdings align with my goals? (Growth, income, or balanced)
□ Fits my age-appropriate allocation? (Check FinanceSwami age table)
□ No overlap with existing holdings? (Check for duplication)
□ Tax-efficient for account type? (High dividend ETFs → Roth IRA preferred)
□ Understand what I’m buying? (Can explain strategy in one sentence)
If 8+ boxes checked = Safe to buy
If 5-7 boxes checked = Proceed with caution
If under 5 boxes checked = Don’t buy
Portfolio Allocation Worksheet by Age
Fill this out to determine your target allocation:
Personal Information:
- Current age: _______
- Years to retirement: _______
- Risk tolerance: Low / Moderate / High
- Primary goal: Growth / Balanced / Income
- Portfolio size: $_______
Select Your Allocation (based on age and risk tolerance):
Ages 25-35:
- [ ] Conservative: 85% VOO / 15% SCHD
- [ ] Moderate: 70% VOO / 30% QQQM
- [ ] Aggressive: 60% VOO / 40% QQQM
Ages 36-45:
- [ ] Conservative: 70% VOO / 20% SCHD / 10% VYM
- [ ] Moderate: 50% VOO / 30% SCHD / 20% QQQM
- [ ] Aggressive: 40% VOO / 40% QQQM / 20% SCHD
Ages 46-55:
- [ ] Conservative: 60% VOO / 30% SCHD / 10% VYM
- [ ] Moderate: 45% VOO / 40% SCHD / 15% VYM
- [ ] Aggressive: 40% VOO / 35% SCHD / 15% VYM / 10% QQQM
Ages 56-64:
- [ ] Conservative: 40% VOO / 40% SCHD / 15% VYM / 5% BND
- [ ] Moderate: 35% VOO / 40% SCHD / 20% VYM / 5% JEPI
- [ ] Aggressive: 30% VOO / 40% SCHD / 20% VYM / 10% JEPI
Ages 65+:
- [ ] Conservative: 30% VOO / 40% SCHD / 20% VYM / 10% BND
- [ ] Moderate: 20% VOO / 50% SCHD / 20% VYM / 10% JEPI
- [ ] Aggressive: 15% VOO / 50% SCHD / 20% VYM / 15% JEPI
Monthly Contribution Calculator
Step 1: Calculate your target monthly contribution
Annual Roth IRA limit: $7,000
Divided by 12 months = $583/month to max Roth IRA
Step 2: Add 401(k) contribution
Your annual salary: $_______
Employer match percentage: %
Minimum contribution to get full match: $__ per month
Step 3: Calculate additional investment capacity
Monthly take-home pay: $_______
Minus essential expenses: $_______
Minus discretionary spending: $_______
Available for investing: $_______
Step 4: Priority allocation
| Priority | Account | Monthly Amount | Annual Total |
| 1 | 401(k) to match | $_______ | $_______ |
| 2 | Roth IRA | $583 (max) | $7,000 |
| 3 | Additional 401(k) | $_______ | $_______ |
| 4 | Taxable brokerage | $_______ | $_______ |
| Total | $_______ | $_______ |
Annual Review Checklist
Complete this every December 31st:
Portfolio Performance:
- Portfolio value today: $_______
- Portfolio value last year: $_______
- Change: $_______ (______%)
- Contributions this year: $_______
- Investment gains: $_______
Allocation Check:
| ETF | Target % | Current % | Drift | Action |
| _______ | _____% | _____% | _____% | _______ |
| _______ | _____% | _____% | _____% | _______ |
| _______ | _____% | _____% | _____% | _______ |
| _______ | _____% | _____% | _____% | _______ |
Rebalancing needed?
□ Yes (drift over 5%) → Execute trades
□ No (within 5%) → No action
Dividend Income:
- Total dividends this year: $_______
- Growth vs. last year: ______%
Contribution Check:
□ Maxed Roth IRA ($7,000)?
□ Got full 401(k) match?
□ Can increase contributions 5-10% next year?
Next Year Changes:
- Increase monthly contribution to: $_______
- Allocation changes needed: _________________
- Next milestone review (age): _______
Portfolio Rebalancing Worksheet
Current allocation:
| ETF | Current $ | Current % | Target % | Difference |
| _______ | $_______ | _____% | _____% | _____% |
| _______ | $_______ | _____% | _____% | _____% |
| _______ | $_______ | _____% | _____% | _____% |
| Total | $_______ | 100% | 100% |
Rebalancing actions (if needed):
Sell (overweight positions):
- Sell $_______ of _______ (reduce from ____% to ____%)
Buy (underweight positions):
- Buy $_______ of _______ (increase from ____% to ____%)
- Buy $_______ of _______ (increase from ____% to ____%)
Implementation date: _______
ETF Comparison Template
Use this to compare two similar ETFs:
ETF Comparison:
| Factor | ETF #1: _______ | ETF #2: _______ | Winner |
| Expense Ratio | _____% | _____% | |
| Assets (AUM) | $_____ | $_____ | |
| Holdings | _____ | _____ | |
| Dividend Yield | _____% | _____% | |
| 5-Year Return | _____% | _____% | |
| Provider | _______ | _______ |
Decision: Buy _______ because: _________________
Retirement Income Projection Worksheet
Current portfolio: $_______
Projected portfolio at retirement:
Years to retirement: _______
Monthly contribution: $_______
Expected return: 9% (moderate) or 10% (aggressive)
Projected value at retirement: $_______
(Use online calculator or financial advisor for exact calculation)
Dividend income projection:
Target dividend allocation at retirement: %
Average dividend yield: 4% (mixed dividend portfolio)
Annual dividend income: $__ × 0.04 = $_______
Monthly dividend income: $_______ ÷ 12 = $_______
4% withdrawal projection:
Portfolio at retirement: $_______
4% annual withdrawal: $_______ × 0.04 = $_______
Total annual income (dividends + withdrawals): $_______
Social Security (estimated):
Annual Social Security benefit: $_______
(Check ssa.gov for your estimate)
Total retirement income:
Dividends: $_______
Withdrawals: $_______
Social Security: $_______
Total annual: $_______
Total monthly: $_______
Expense coverage check:
Target retirement expenses (150% of current): $_______
Projected income: $_______
Surplus / (Deficit): $_______
□ On track (surplus or small deficit)
□ Need to increase savings (significant deficit)
First-Time Investor Checklist
Use this if you’re just starting:
Week 1: Account Setup
□ Choose brokerage (Fidelity, Vanguard, or Schwab)
□ Open Roth IRA (15-20 minutes)
□ Link bank account
□ Wait for verification (2-3 days)
Week 2: First Purchase
□ Transfer initial money ($500-$5,000)
□ Money arrives in account
□ Buy first ETF (VOO or VTI)
□ Buy second ETF if using two-fund (QQQM or SCHD)
□ Verify purchases executed
Week 3: Automation
□ Set up automatic monthly transfer ($583 or affordable amount)
□ Set up automatic investment (same allocation as initial purchase)
□ Verify automation settings correct
Week 4: 401(k) and Planning
□ Enroll in 401(k) if available
□ Select 401(k) investments (S&P 500 index or target-date)
□ Set December 31st annual review reminder
□ Write down investment plan
□ Stop checking account frequently
Congratulations—you’re an investor!
These tools and checklists remove the guesswork from ETF investing. Print them, fill them out, refer back to them annually. They provide the structure to stay disciplined over decades.
16. Frequently Asked Questions
Q: Should I buy ETFs or mutual funds?
A: ETFs for most people. They’re more tax-efficient, trade like stocks (more flexible), and typically have lower expense ratios. The only advantage of mutual funds is automatic investment of exact dollar amounts at some brokerages—but most brokerages now offer fractional ETF shares, eliminating this benefit.
FinanceSwami recommendation: Use ETFs (VOO, QQQM, SCHD, etc.) unless your 401(k) only offers mutual funds.
Q: Can I lose all my money in ETFs?
A: Highly unlikely with diversified index ETFs. For VOO (S&P 500) to go to zero, all 500 of America’s largest companies would need to fail simultaneously. This has never happened and would require societal collapse.
Worst historical drawdown: -57% (2008 financial crisis). Market recovered fully within 6 years and reached new highs.
Your risk is temporary declines (20-50%), not permanent loss to zero.
Q: How many ETFs should I own?
A: 2-5 ETFs maximum according to FinanceSwami Ironclad Investment Strategy Framework.
- Minimum: 1 ETF (100% VOO works fine)
- Optimal for beginners: 2 ETFs (70% VOO / 30% QQQM)
- Optimal for income-focused: 3-4 ETFs (40% VOO / 35% SCHD / 20% VYM / 5% JEPI)
- Maximum recommended: 5 ETFs (only if using very specialized allocation)
More than 5 creates unnecessary complexity without additional diversification.
Q: Should I dollar-cost average or invest a lump sum?
A: Research shows lump-sum investing beats dollar-cost averaging about 66% of the time because markets go up more than they go down.
However, if you have $50,000 sitting in cash and you’re nervous about investing it all at once, dollar-cost average over 3-6 months for psychological comfort. The performance difference is usually small (1-2%).
FinanceSwami recommendation: Invest lump sums immediately if you’re comfortable. Dollar-cost average over 3-6 months if you’re nervous. Either way, don’t wait more than 6 months.
Q: When should I sell my ETFs?
A: Almost never. ETFs are buy-and-hold investments.
The only times to sell:
- Rebalancing: When allocation drifts 5%+ from target
- Life stage shift: Gradually moving from growth (QQQM) to dividend (SCHD) as you age
- Replacing underperforming fund: If an ETF provider increases fees dramatically or fund strategy changes
- Retirement withdrawals: After age 65, selling small amounts for living expenses
Never sell because:
- Market crashed
- News scared you
- You think market will go down
- Friend recommended something different
- ETF had a bad year
Q: What if I’m 50 and just starting to invest?
A: You can still build substantial wealth. With 15 years to retirement:
$2,000/month invested at 10% = $828,000 at age 65
$3,000/month invested at 10% = $1,242,000 at age 65
Recommended allocation for late starters (age 50):
- 40% VOO (some growth still needed)
- 40% SCHD (dividend income base)
- 20% VYM (additional diversification)
Late start means you need higher savings rate (20-30% of income vs. 15% if you started earlier), but substantial wealth is still achievable.
Q: Are dividend ETFs better than growth ETFs?
A: Depends on your age and goals.
Growth ETFs (VOO, QQQM):
- Higher total returns historically
- Lower current income
- Higher volatility
- Better for ages 25-45
Dividend ETFs (SCHD, VYM):
- Lower total returns but consistent income
- Higher current income
- Lower volatility
- Better for ages 45+
According to research analyzing 50 years of returns, growth stocks outperform dividend stocks by 1-2% annually during bull markets, but dividend stocks outperform during bear markets and provide more stable cash flow.
FinanceSwami recommendation: Use growth when young, shift to dividends as you age. Total wealth matters more than dividend vs. growth debate.
Q: Should I invest in international ETFs?
A: Optional, not required.
Arguments for international:
- Additional diversification beyond U.S.
- Exposure to emerging markets growth
- Hedge against U.S.-specific problems
Arguments against (FinanceSwami perspective):
- U.S. companies already earn 50%+ revenue internationally
- International stocks have underperformed U.S. for past 15 years
- Adds complexity and typically higher fees
- Many countries have less shareholder-friendly laws
FinanceSwami recommendation: Focus on U.S. ETFs (VOO, SCHD, etc.). If you want international exposure, add 10-20% VXUS (Total International Stock Market). Not required for beginners.
Q: What if an ETF I own closes?
A: Rare but possible for low-asset ETFs.
What happens:
- You’re notified 30-60 days in advance
- Fund is liquidated on a specific date
- You receive cash proceeds (taxable event in taxable accounts)
- You buy replacement ETF with proceeds
How to avoid:
- Only buy ETFs with $1B+ in assets
- Stick to major providers (Vanguard, Fidelity, Schwab, BlackRock)
- Avoid trendy thematic ETFs
If you follow the 8 core ETFs I recommended, closure risk is essentially zero. VOO, SCHD, VYM, QQQM are all massive funds that will never close.
Q: Can I hold ETFs in an IRA and a taxable account?
A: Yes, and you should use different ETFs in each for tax efficiency.
Roth IRA (tax-free forever):
- Prioritize high-dividend ETFs: SCHD, VYM, JEPI
- Reason: Dividends grow tax-free forever
401(k) (tax-deferred):
- Use whatever your employer offers
- Typically S&P 500 index or target-date funds
Taxable brokerage (taxed annually):
- Prioritize tax-efficient growth ETFs: VOO, VTI, QQQM
- Reason: Low dividends, mostly capital gains (taxed only when you sell)
This tax-efficient placement saves thousands in taxes annually.
Q: Should I buy ETFs during a recession?
A: Yes, absolutely. Recessions are the best time to buy—stocks are on sale.
Historical fact: Investors who bought during every recession (1980, 1990, 2001, 2008, 2020) made exceptional returns by simply holding for 5-10 years.
2008 recession example:
- Bought VOO March 2009 at $60
- Held until 2019: VOO at $280
- 10-year return: 367% (16.6% annually)
Don’t try to time the bottom. If we’re in a recession and you have money, invest it. If we’re not in a recession, invest it anyway.
Market timing doesn’t work. Time in market works.
Q: What’s the difference between VOO and SPY?
A: They track the identical index (S&P 500). Only difference is expense ratio:
- VOO: 0.03% expense ratio
- SPY: 0.09% expense ratio (3x more expensive)
SPY is older and has higher trading volume, but this doesn’t matter for buy-and-hold investors. VOO is better because it’s cheaper.
FinanceSwami recommendation: Always choose VOO over SPY. They’re identical except VOO saves you money.
Q: How do I know if I’m on track for retirement?
A: Use this rough benchmark:
| Age | Target Portfolio | How to Check |
| 30 | 1× annual salary | If you earn $60k, have $60k invested |
| 40 | 3× annual salary | If you earn $80k, have $240k invested |
| 50 | 6× annual salary | If you earn $100k, have $600k invested |
| 60 | 8× annual salary | If you earn $120k, have $960k invested |
| 65 | 10× annual salary | If you earn $120k, have $1.2M invested |
These are approximations. According to the FinanceSwami Ironclad Retirement Planning Framework, you need 25-35× your expected annual retirement expenses saved (using 4% rule).
Q: Should I pause investing during high inflation?
A: No. Invest more, not less. Inflation makes investing even more important.
Cash loses 3-5% purchasing power annually during high inflation. Stocks historically provide inflation protection—corporate revenues and profits rise with inflation, pushing stock prices higher over time.
Historical data from 1970s high inflation: Stocks vastly outperformed cash despite volatility.
Don’t stop investing during inflation. Speed up investing.
Q: Are there commodity etfs I should consider as a beginner?
A: No. Commodity ETFs that invest in gold, oil, agricultural products, or other physical commodities are not appropriate for beginners. They’re speculative, highly volatile, and don’t provide the steady long-term growth that broad market equity etfs deliver. Commodities don’t generate earnings or dividends—they only rise if someone is willing to pay more for them tomorrow than you paid today. That’s speculation, not investing. Stick to stock-based ETFs that represent actual businesses generating profits.
Q: What about inverse etfs for protection during market crashes?
A: Absolutely avoid inverse etfs. These are designed to profit when markets fall, which sounds appealing until you understand how destructive they are to long-term wealth. Inverse ETFs use leverage and derivatives, reset daily, and experience severe “decay” over time. They’re trading instruments for professionals, not investment vehicles for building wealth. The FinanceSwami approach is to stay fully invested during crashes, continue automatic contributions, and benefit when markets recover—not to try timing crashes with inverse products.
Q: How do I know if etfs are generally a good choice for my situation?
A: ETFs are generally appropriate for almost everyone building long-term wealth. The exceptions are very rare: if you need money within 2-3 years (keep it in savings instead), if you have high-interest debt above 7% (pay that off first), or if you don’t have an emergency fund (build that before investing aggressively). Beyond these situations, low-cost broad market etfs are the right foundation for systematic wealth building regardless of your income, age, or starting amount.
Q: Can I mix etfs and mutual funds in the same portfolio?
A: You can, but I don’t recommend it. ETFs offer superior tax efficiency, lower costs, and greater flexibility compared to most mutual funds. The case with etfs is that they accomplish everything mutual funds do, but more efficiently. If you already own mutual funds and they’re low-cost index funds from Vanguard or Fidelity, you can keep them—they’ll work fine. But if you’re building a portfolio from scratch or consolidating holdings, use ETFs exclusively. No need to complicate things by mixing both.
Q: Since etfs trade on exchanges, does that mean I need to watch the market all day?
A: No. This is a critical misconception that stops people from investing. Yes, etfs trade throughout the day and prices fluctuate minute by minute. But that doesn’t mean you should watch them. In fact, watching daily price movements is counterproductive—it encourages emotional decision-making and unnecessary trading. The FinanceSwami approach is to buy ETFs, set up automatic contributions, and check your portfolio once per year. The fact that ETFs trade like stocks doesn’t mean you should treat them like day trading instruments.
Q: What if I choose popular etfs that everyone else is already investing in?
A: That’s actually ideal. The most popular etfs are popular because they’re low-cost, broadly diversified, tax-efficient, and have proven track records. VOO, VTI, and QQQ are popular for good reason—they work. This isn’t fashion where you want to be unique. This is wealth-building where you want to use proven, reliable tools. When millions of investors choose the same ETFs, it increases their liquidity, reduces trading costs, and validates that the strategy works. Don’t avoid popular ETFs—embrace them.
Q: Is regularly investing a fixed amount really better than investing lump sums?
A: Both strategies work, but regularly investing a fixed amount (called dollar-cost averaging) has two key advantages: it removes the emotional burden of timing the market, and it ensures you’re buying more shares when prices are low and fewer shares when prices are high. This automatic contrarian approach works in your favor. If you receive a lump sum (bonus, inheritance, windfall), you can invest it immediately—time in the market beats timing the market. But for most people building wealth through monthly paychecks, consistent automatic contributions are both easier and more effective than trying to save up lump sums.
Q: Should I invest in international etfs for diversification?
A: International diversification is optional, not required. Many top U.S. companies in the S&P 500 already generate 40-60% of revenue internationally, giving you global exposure through domestic ETFs. If you want explicit international exposure, you can allocate 10-20% to a developed markets ETF like VEA or an emerging markets ETF like VWO. But U.S. stocks should remain your foundation—they offer the best combination of growth, liquidity, and long-term performance. International etfs are a supplement, not a core holding.
17. Conclusion: Start Simple, Stay Simple
If you’ve read this far, you understand ETFs better than most investors—maybe better than most financial advisors.
You know what ETFs are and how they work. You know the 8 core ETFs that are genuinely best for beginners. You know how to combine them into simple portfolios based on your age. You know what dangerous ETFs to avoid. And you know exactly how to buy your first ETF and set up automatic investing.
Now comes the most important part: actually starting.
I know it’s still tempting to do more research, read more articles, wait for the “perfect time,” or try to optimize every last detail. But I’m going to tell you the same thing I told myself when I was starting: perfect is the enemy of good.
The portfolios I’ve shown you—whether it’s the ultra-simple 100% VOO, or the balanced 50% VOO / 30% SCHD / 20% VYM, or any combination of the 8 core ETFs—are all excellent. They will build wealth. The specific ETFs you choose matter far less than:
- Starting today (not next month or next year)
- Investing consistently ($500-$1,000+ every single month)
- Staying invested through crashes (never panic-selling)
- Keeping it simple (2-5 core holdings, not 20)
- Following your plan for decades (checking once per year, not daily)
According to the FinanceSwami Ironclad Investment Strategy Framework, building wealth isn’t about complexity or genius. It’s about:
- Starting with your first $50,000 in simple index funds (VOO + QQQM)
- Maintaining 85-100% stocks across all ages
- Shifting within stocks from growth to dividend as you age
- Keeping portfolios simple with 2-5 core holdings
- Staying disciplined through all market conditions
- Planning conservatively for 100-150% of current expenses in retirement
This simple approach has built millions of dollars for millions of people. It’s boring. It’s proven. It works.
Here’s what I want you to do this week:
If you haven’t started investing yet, pick one of the ready-to-use portfolios from section 6. Open a Roth IRA at Fidelity, Vanguard, or Schwab. Link your bank account. Transfer $500, $1,000, or whatever you have. Buy your chosen ETFs in the recommended percentages. Set up automatic monthly contributions. That’s it. You’re done. You’re now an investor.
If you’re already investing but not following a clear strategy, use this guide to simplify. Maybe you have 12 ETFs when you only need 3. Consolidate. Maybe you’re not contributing consistently. Set up automation. Maybe you haven’t checked your allocation in 2 years. Do your December 31st review.
The opportunity is in front of you right now. The ETFs exist. The brokerages are free. The strategy is proven. The knowledge is in your hands.
All that’s left is the decision to start.
Ten years from now, you’ll look back at this moment. You’ll either think “I’m so glad I started investing in ETFs when I did” or “I wish I had started back then.” That decision is being made right now.
Don’t overcomplicate it. Don’t wait for perfect. Don’t delay.
Pick 2-4 ETFs from the core list. Buy them. Hold them for decades. That’s the whole strategy.
Start simple. Stay simple. Build wealth.
18. About FinanceSwami & Important Note
FinanceSwami is a personal finance education site designed to explain money topics in clear, practical terms for everyday life.
Important note: This content is for educational purposes only and does not constitute personalized financial advice.
19. Keep Learning with FinanceSwami
If this guide helped you understand ETFs and gave you the confidence to start investing, there’s much more I want to share with you.
I’ve created FinanceSwami to be your complete resource for personal finance education—covering not just ETF investing, but comprehensive retirement planning, dividend income strategies, portfolio construction, budgeting, debt management, and income generation. Everything is explained with the same patient, clear, beginner-friendly approach you’ve experienced in this guide.
On the FinanceSwami blog, you’ll find in-depth guides on topics like the complete FinanceSwami Ironclad Retirement Planning Framework (which explains why you should plan for 100-150% of current expenses in retirement, not the traditional 70% rule), the FinanceSwami Ironclad Investment Strategy Framework (covering the complete rationale for maintaining 85-100% stocks across all ages and shifting within stocks rather than to bonds), systematic wealth-building through the three-phase framework, advanced dividend investing strategies, and age-based portfolio construction.
I also create video content on my YouTube, where I walk through portfolio construction examples, demonstrate how to actually buy your first ETFs step-by-step, explain the math behind retirement calculations and dividend compounding, review specific ETFs in detail, and cover how to adjust allocations as you transition through different life stages. Sometimes seeing these concepts explained visually—like watching dividend income grow over 30 years or understanding how allocation shifts affect retirement income—helps them click in ways that reading alone doesn’t.
The ETF investment strategy you’ve learned here is built on core principles that run through everything I teach: Build a 12-month emergency fund before taking significant investment risk. Use low-cost index funds and dividend ETFs as your foundation. Maintain high stock allocation (85-100%) across all life stages, shifting within stocks from growth to dividend rather than shifting to bonds. Keep portfolios simple with 2-5 core holdings. Focus on building sustainable income streams through quality dividend-paying investments. Plan conservatively with 100-150% expense replacement and a 35-year retirement horizon, but invest aggressively in stocks.
These aren’t mainstream recommendations. Traditional financial advice says to shift heavily to bonds as you age (60-70% bonds by retirement) and plan for only 70% expense replacement. I believe traditional advice sets people up for financial stress in their later years because it underestimates healthcare costs, inflation, longevity, and the need for family generosity. The FinanceSwami approach is designed to help you build enough wealth to retire comfortably with a meaningful income cushion, handle rising expenses without anxiety, support family when unexpected needs arise, and never worry about running out of money regardless of how long you live.
Thank you for investing the time to read this guide. Now take the next step. If you haven’t implemented your ETF investment strategy yet, do it this week. Open that Roth IRA. Buy your first core ETFs. Set up automatic contributions. If you’re already investing but your strategy doesn’t match the FinanceSwami age-based allocations, make the adjustments gradually. And if you’re on track, set that December 31st reminder for your annual review and stay disciplined.
ETF investing is how normal people build extraordinary wealth. You have everything you need to start—the knowledge, the strategy, the specific ETFs, and the step-by-step instructions.
The only thing left is taking action.
Your financial future is being built today, one decision at a time. Make the decision to start with ETFs.
— FinanceSwami