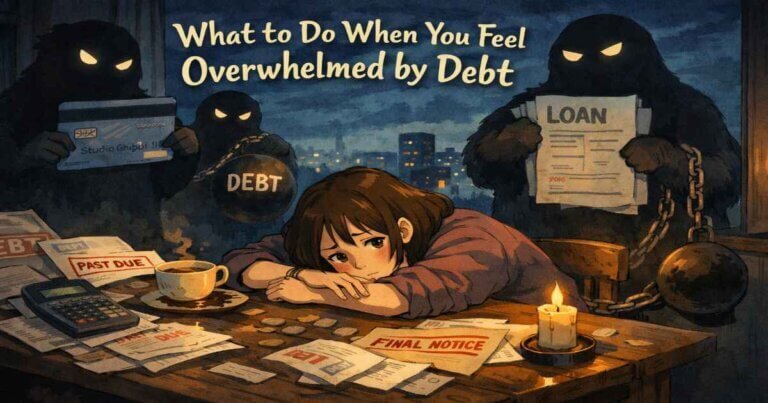
Introduction
I talk to people every single day who tell me the same thing: “I know I should be investing, but I have no idea where to start.”
Maybe that’s you right now. Maybe you’ve heard friends talk about their portfolios, or you’ve seen headlines about the stock market, and you think to yourself: “I should probably be doing that too.” But then you google “how to start investing,” and you’re immediately overwhelmed. Every article assumes you already know what stocks and bonds are, or that you understand terms like “diversification” and “expense ratio,” or that you’re comfortable navigating financial jargon without explanation.
Here’s what I want you to know right up front: investing is not just for wealthy people, financial experts, or people with fancy degrees. It’s for everyone. And more importantly, it’s something you need to do if you want to build real wealth over your lifetime. Your salary pays for life today. Investing builds wealth for tomorrow.
This guide is written for complete beginners. I’m going to walk you through everything you need to know to start investing—what it is, why it matters, how to actually do it, and what mistakes to avoid. I’m not going to assume you know anything about finance. I’ll define every term before using it. I’ll explain every concept simply before adding complexity.
By the end of this guide, you’ll understand not just how to start investing, but why it matters, what to invest in, how much to invest, and how to avoid the common pitfalls that trip up beginners.
This is everything I wish someone had explained to me when I was first starting out.
Plain-English Summary
Let me tell you what we’re going to cover in this guide.
First, I’m going to explain what investing actually is in the simplest possible terms—because if you don’t understand the basics, everything else will feel overwhelming. Then I’ll show you exactly why investing matters right now, in 2026, and what happens if you don’t invest. I’ll break down how investments actually make you money, covering concepts like compound interest and capital appreciation in plain English.
From there, we’ll cover the basics: different types of investments you can make, how much money you need to get started (spoiler: less than you think), and the financial foundation you need in place before you invest your first dollar. I’ll introduce you to index funds and explain why they’re perfect for beginners who don’t want to spend hours researching individual stocks.
Most importantly, I’m going to give you step-by-step instructions for actually starting—what accounts to open, where to open them, what to buy, and how much. No vague advice, no jargon. Just clear, actionable steps you can follow this week.
I’ll also explain the FinanceSwami Ironclad Investment Strategy Framework—my core philosophy for building wealth through disciplined, patient investing. This framework emphasizes building a solid emergency fund first, then investing systematically in low-cost index funds, and shifting your allocation from growth to income as you age. It’s built on conservative planning assumptions and proven strategies that work for normal people building real wealth over decades.
By the end of this guide, you’ll understand not just how to start investing, but why it matters, what the realistic risks are, and how to build wealth steadily over time using strategies that have worked for millions of people.
Let’s eliminate the confusion and get started.
Table of Contents
1. What Is Investing? (Simple Definition)
Let me explain investing in the simplest way possible.
Investing means putting your money into something that has the potential to grow in value over time.
That’s it. You’re not gambling. You’re not speculating. You’re putting money into assets—like stocks, bonds, or real estate—that historically tend to increase in value over the long term.
Think of it this way: when you keep money in a regular checking account, it just sits there. It doesn’t grow. Actually, it loses value over time because of inflation. But when you invest that money, you’re giving it the opportunity to multiply. You’re putting it to work.
What investing is NOT:
Investing is not day trading. It’s not trying to “beat the market” or get rich quick. It’s not gambling or hoping to pick the next Amazon before anyone else figures it out.
Real investing—the kind that builds actual wealth—is patient, boring, and consistent. You put money in regularly, you leave it alone for years or decades, and you let compound growth do the heavy lifting. That’s how normal people become millionaires.
According to research analyzing 95 years of stock market data, patient investors who simply bought and held diversified investments earned an average of about 10% annually. That doesn’t sound exciting, but over 30 years, it turns modest monthly contributions into substantial wealth.
Let me show you what this looks like:
| Monthly Investment | Years Invested | Average Return | Final Value |
| $500 | 30 years | 10% | $1,028,000 |
| $500 | 30 years | 7% | $620,000 |
| $500 | 30 years | 4% (savings) | $349,000 |
Five hundred dollars per month invested at 10% annually becomes over one million dollars in 30 years. That’s the power of investing. Not luck. Not genius stock picking. Just patience and consistency.
2. Why Investing Matters in 2026
You might be wondering: why does investing matter right now? Can’t I just save money in a bank account?
Here’s the uncomfortable truth: if you’re not investing, you’re losing money.
Let me explain why with some real numbers from 2026.
Right now, inflation is running at about 3% annually. That means the cost of living increases by roughly 3% every year. Your rent goes up. Your groceries cost more. Healthcare becomes more expensive. Everything slowly gets more expensive over time.
Meanwhile, if you’re keeping money in a regular checking account, you’re earning maybe 0.1% interest. Or if you’ve found a good high-yield savings account, you might be earning 4-5% interest.
Let’s compare what happens over 30 years:
The Saving vs. Investing Comparison:
| Strategy | Monthly Amount | Years | Nominal Value | After 3% Inflation | Real Purchasing Power |
| Savings account (4%) | $500 | 30 | $349,000 | Adjusted down | $144,000 |
| Stock investing (10%) | $500 | 30 | $1,028,000 | Adjusted down | $425,000 |
| Difference | Same $500 | Same 30 years | +$679,000 | – | +$281,000 |
If you save $500 per month in a savings account earning 4% annually, after 30 years you’ll have about $349,000. That sounds decent until you account for inflation. After 30 years of 3% inflation, that $349,000 has the purchasing power of only about $144,000 in today’s dollars. You’ve barely kept pace with inflation.
Now, if you invest that same $500 per month in a diversified stock portfolio earning an average of 10% annually (which is the historical average), after 30 years you’ll have about $1,028,000. After accounting for inflation, that’s still about $425,000 in today’s purchasing power.
The difference between saving and investing is $679,000 in actual dollars—or about $281,000 after accounting for inflation.
Same monthly contribution. Completely different outcome.
This is why investing isn’t optional if you want to build wealth. Saving money in a bank account is great for your emergency fund and short-term goals. But for long-term wealth building, investing is the only realistic path forward.
3. How Investing Actually Makes You Money
The fundamental idea behind investing is making your money work for you instead of you working for every dollar. Let me explain what this actually means in practical terms, because this concept is the foundation of everything else in this guide.
What “Money Working for You” Actually Means
When you work a job, you trade your time and effort for money. You work 40 hours, you get paid for 40 hours. If you don’t work, you don’t get paid. Your earning is directly tied to your time and labor.
When you invest, you’re putting your money into assets that generate returns without requiring your active time and effort. Your invested dollars work 24/7, 365 days per year, growing through compound returns even while you sleep, spend time with family, or focus on other priorities. This is how people build substantial wealth over time – not just through earning, but through owning assets that grow in value and generate income independently.
Think of it this way: if you have $10,000 in a savings account earning 0.5% interest, your money is barely working – it’s generating $50 per year, which doesn’t even keep up with inflation. But if that same $10,000 is invested in index funds that historically average 10% annual returns, it grows to approximately $11,000 in year one, $12,100 in year two, $13,310 in year three – compounding without requiring any additional effort from you beyond the initial decision to invest your money.
Let me break down the three ways investments grow your wealth.
Method #1: Capital Appreciation
This is when the thing you bought increases in value over time. If you buy stock in a company for $100 and ten years later it’s worth $250, you’ve made $150 through capital appreciation. The asset itself became more valuable. This growth in the asset’s price is called capital appreciation, and it’s one major way your money works for you. You’re not doing anything – the companies you own shares in are growing their businesses, becoming more profitable, and the market values them higher as a result. This growth potential is what makes stocks attractive for long-term wealth building despite short-term volatility.
Why does this happen? Good companies grow their businesses. They expand to new markets, launch successful products, increase their profits, and become more valuable over time. As the company grows, so does the value of your ownership stake.
Method #2: Income Payments (Dividends and Interest)
Many investments pay you money just for owning them. Stocks pay dividends (quarterly distributions of company profits to shareholders), bonds pay interest, and real estate investments pay rental income distributions. These payments come to you without requiring any active work. A portfolio of dividend-paying stocks worth $100,000 might generate $2,000-3,000 annually in dividends that you can reinvest to buy more shares, creating a compounding cycle where your money generates money that generates more money.
Many investments pay you money just for owning them:
- Stocks often pay dividends—regular cash payments to shareholders
- Bonds pay interest—fixed payments for lending money
- Real estate pays rent—income from tenants
This income can be reinvested to buy more assets (which compounds your growth), or you can take it as cash for living expenses (which is what many retirees do).
According to the FinanceSwami Ironclad Investment Strategy Framework, quality dividend-paying stocks can serve the same purpose bonds traditionally filled—providing income—while also offering growth potential and inflation protection that bonds don’t provide.
Method #3: Compound Interest (The Most Powerful)
This is when your gains start generating their own gains. Let me give you an example that shows the power of compounding:
Compound Interest Example:
| Year | Starting Balance | 10% Gain | End Balance | Annual Gain Amount |
| 1 | $10,000 | $1,000 | $11,000 | $1,000 |
| 2 | $11,000 | $1,100 | $12,100 | $1,100 |
| 3 | $12,100 | $1,210 | $13,310 | $1,210 |
| 10 | $23,579 | $2,358 | $25,937 | $2,358 |
| 20 | $61,159 | $6,116 | $67,275 | $6,116 |
| 30 | $158,631 | $15,863 | $174,494 | $15,863 |
You invest $10,000 and earn 10% in year one, giving you $1,000 in gains. Your balance is now $11,000. In year two, you earn 10% on $11,000—not the original $10,000—so you make $1,100. In year three, you earn 10% on $12,100, giving you $1,210. Your gains keep growing because they’re based on an increasingly larger amount.
Notice how your annual gains accelerate dramatically over time. In year 1, you earned $1,000. By year 30, you’re earning $15,863 in a single year—almost 16 times more, even though the growth rate stayed constant at 10%.
Over time, this compounding effect becomes incredibly powerful. That initial $10,000 becomes $174,494 after 30 years—all without adding another dollar. Your money did all that work while you slept, went to work, and lived your life.
This is why starting early matters so much. The longer your money has to compound, the more wealth you build. Every year you delay costs you tens of thousands of dollars in potential future wealth.
According to the FinanceSwami Ironclad Retirement Planning Framework, which I use across all my retirement calculations, you should:
- Plan for retirement expenses at 100-150% of your current annual expenses (not the traditional 70% rule)
- Assume a 35-year retirement horizon
- Use the 4% rule only as a starting point
This conservative approach requires building substantial wealth through consistent investing—which makes understanding compound interest essential.
The Real Power: Time and Consistency
Making your money work isn’t about finding secret investment strategies or timing the market perfectly. It’s about starting early, contributing consistently, and staying invested for long periods. Here’s why time is so critical:
If you invest $500 per month starting at age 25 and average 10% annual returns, by age 65 you’ll have approximately $3.2 million. If you wait until age 35 to start with the same $500 monthly contribution and same 10% returns, you’ll have approximately $1.1 million at 65 – less than a third of what you’d have by starting ten years earlier. Those first ten years, when your balance is still relatively small, actually contribute over $2 million to your final wealth because of how compound growth works over four decades.
This is why investing isn’t just about how much money you make or how sophisticated your strategy is – it’s primarily about how long your money has been working for you. Someone who starts with $1,000 at age 20 and contributes $200 monthly will likely end up wealthier than someone who waits until age 40 and contributes $1,000 monthly, even though the second person is putting in five times as much. Time is the most powerful variable in the equation, and you can’t buy it back once it’s gone. Investing can help you secure your financial future precisely because time transforms modest contributions into substantial wealth through the power of compounding.
4. Why Most People Don’t Put Their Money to Work
If putting money to work through investing is so powerful, why don’t more people do it? Several common barriers prevent people from investing even when they intellectually understand they should:
Barrier 1: They don’t understand it – Investing seems complicated and intimidating, so people avoid it. This guide exists to eliminate that barrier by explaining investing in plain language anyone can understand.
Barrier 2: They think they need a lot of money to get started – Many people believe investing requires tens of thousands of dollars, when reality is you can start with as little as $100-500. Modern brokerages allow fractional share purchases, meaning you can invest small amounts regularly. While you do need money to get started investing, the amount required is much smaller than most people think.
Barrier 3: They’re afraid of losing money – Yes, investing involves risk and your investments may lose value in the short term. But NOT investing guarantees you lose purchasing power to inflation. Cash sitting in savings loses approximately 2-3% of its value annually, whereas invested money historically grows 7-10% annually after inflation. Understanding that investing involves risk is essential, but so is understanding that not investing carries its own risks.
Barrier 4: They’re waiting for the “right time” – People think they need to wait until they earn more, until the market drops, until they understand everything perfectly. The truth is there’s never a perfect time, and waiting costs you years of compound growth you can never recover.
The goal of this guide is to help you overcome these barriers and actually start putting your money to work through smart, simple, disciplined investing. You don’t need to become a financial expert or dedicate hours per week to managing investments. You need to understand the basics, make good initial decisions, and then let time and compound growth do the heavy lifting while your money works for you in the background of your life.
5. Types of Investments Explained
Let me walk you through the main types of investments you need to know about as a beginner.
Stocks (Equities)
Stocks represent ownership in companies. When you buy a share of stock, you own a tiny piece of that business. If the company grows and becomes more profitable, your shares become more valuable. Many stocks also pay dividends, which are regular cash payments to shareholders.
Historically, stocks have returned about 10% annually over long periods, though they can be quite volatile in the short term. According to research by Ibbotson Associates analyzing data from 1926-2023, large-cap stocks have provided an average annual return of approximately 10.3%, making them the highest-returning major asset class over the long term.
Bonds (Fixed Income)
Bonds are loans you make to governments or corporations. When you buy a bond, you’re essentially lending money in exchange for regular interest payments and the return of your principal at the end. Bonds are generally less risky than stocks but also offer lower returns—typically 4-6% annually.
According to the FinanceSwami Ironclad Investment Strategy Framework, I recommend minimal bond allocation:
- 0% bonds for investors under age 55
- 5-10% bonds for ages 55-64
- 10-15% bonds maximum for those 65 and older
Why this differs from traditional advice: Quality dividend-paying stocks can serve the same role bonds traditionally filled—providing income—while also offering growth potential and inflation protection that bonds don’t provide.
Index Funds (The Beginner’s Best Friend)
Index funds are collections of many stocks bundled together into a single investment. For example, an S&P 500 index fund owns all 500 of the largest publicly traded companies in America. By buying one index fund, you instantly own tiny pieces of hundreds of companies, giving you broad diversification with a single purchase.
Index funds are perfect for beginners because:
- They require no research or stock-picking skills
- They charge very low fees (typically 0.03% to 0.15% annually)
- They provide instant diversification
- They have consistently outperformed 85-90% of professional fund managers over 15+ year periods
Real Estate (REITs)
Real estate includes both physical property you can own directly and REITs (Real Estate Investment Trusts), which are companies that own income-producing properties. REITs trade like stocks and pay high dividends from rental income. Real estate can provide diversification, income, and inflation protection, but it’s typically a smaller part of a beginner’s portfolio (5-10%).
Investment Type Comparison:
| Investment Type | Expected Return | Volatility | Best For | FinanceSwami Allocation |
| Stocks | ~10% annually | High (short-term) | Long-term growth | 85-100% across all ages |
| Bonds | ~5-6% annually | Low | Stability (ages 55+) | 0-15% maximum |
| Index Funds | ~10% annually | Moderate | Beginners, diversification | Core holding (60-80%) |
| REITs | ~9-10% annually | Moderate-High | Income, diversification | 5-10% (ages 50+) |
For most beginners, your focus should be on low-cost stock index funds. They provide instant diversification, require zero expertise, charge minimal fees, and have delivered solid long-term returns.
According to the FinanceSwami Ironclad Investment Strategy Framework, your first $50,000 should go into simple index funds like:
- VOO (Vanguard S&P 500 ETF) – 70% allocation
- QQQM (Invesco Nasdaq-100 ETF) – 30% allocation
This gives you 100% stock allocation with broad diversification across 600 companies and very low fees (0.03% and 0.15% respectively).
For portions of your portfolio allocated to conservative assets, money market funds offer a safe option with slightly higher yields than regular savings accounts while maintaining liquidity and principal protection. Money market funds invest in short-term, high-quality debt instruments and typically yield 4-5% in current market conditions – significantly higher than most savings accounts but without the volatility of stock investments. They’re appropriate for emergency funds or money you might need within 1-3 years, but they should not dominate a long-term investment portfolio because their returns barely exceed inflation over time. In your overall allocation, money market funds or similar cash equivalents might represent 5-15% of holdings for stability, while the majority remains in stocks for growth needed to build substantial wealth over decades.
6. How Much Money Do You Need to Start Investing?
This is one of the most common questions I get, and the answer might surprise you.
You can literally start investing with $100, $500, or even $1 if that’s all you have. Most major brokerages—Fidelity, Vanguard, Schwab—have zero account minimums and allow you to buy fractional shares of stocks and ETFs. You could open an account today with $50 and buy a fractional share of an S&P 500 index fund.
But here’s what I actually recommend as realistic starting amounts:
FinanceSwami Recommended Starting Amounts:
| Starting Amount | What It Provides | Best For |
| $100-$500 | Absolute minimum to open account and start | Complete beginners taking first step |
| $1,000-$3,000 | Comfortable diversification across 2-3 funds | Most people starting out |
| $5,000-$10,000 | Strong foundation with proper allocation | Ideal starting position |
Absolute minimum: $500. This gives you enough to open an account, buy a meaningful position in an index fund, and start your investing journey. It’s enough to feel real and to get compound interest working for you.
Comfortable starting amount: $1,000 to $3,000. This lets you properly diversify across two or three funds, such as putting 70% in an S&P 500 index fund and 30% in a growth-focused Nasdaq fund. You have enough invested that the gains start to feel meaningful.
Ideal starting position: $5,000 to $10,000. This provides a strong foundation for continued monthly contributions and gives compound interest a substantial base to work from.
But here’s the thing: the starting amount is actually the least important factor in building wealth. What matters far more is your monthly contributions and how long you stay invested.
Let me show you what I mean with real numbers:
Starting Amount vs. Monthly Contributions:
| Scenario | Initial Investment | Monthly Contribution | Years | Total Invested | Final Value (10%) |
| Large lump sum | $10,000 | $0 | 30 | $10,000 | $174,494 |
| Small start + consistency | $1,000 | $500 | 30 | $181,000 | $1,046,000 |
Someone who starts with $1,000 and adds $500 every month will build far more wealth ($1,046,000) than someone who starts with $10,000 and never adds another dollar ($174,494). The monthly contributions matter far more than the lump sum.
The real power is in consistency, not the starting amount.
So don’t let “I don’t have enough money” stop you from starting. Start with whatever you have—even if it’s just $100—and focus on building the habit of consistent monthly contributions.
7. Before You Invest: Financial Foundation Checklist
Before you invest your first dollar in the stock market, you need to make sure you have a solid financial foundation in place. Investing without this foundation is like building a house on sand—one unexpected expense or emergency can force you to sell investments at the worst possible time.
Here’s the checklist you need to complete before you start investing:
Pre-Investing Financial Foundation Checklist:
□ Pay off high-interest debt (credit cards above 15%, personal loans above 8%)
□ Get full employer 401k match (if available)
□ Build 3-6 month emergency fund (minimum before investing)
□ Build toward 12-month emergency fund (complete within 2-3 years)
□ Understand your monthly expenses (track for 2-3 months)
□ Set up automatic savings (system for consistent contributions)
Let me break down each item:
Step 1: Pay Off High-Interest Debt
If you’re carrying credit card balances at 18% or 20% interest, paying those off is a guaranteed 18-20% return on your money—far better than any investment. You can’t build wealth while paying 20% interest on debt. Get rid of high-interest debt first, then invest.
What qualifies as “high-interest”?
- Credit cards (typically 15-25% APR) – pay these off immediately
- Personal loans above 8% – pay these off before investing
- Auto loans above 7% – consider paying off before investing
- Student loans below 6% – can invest while paying these
- Mortgage below 5% – definitely invest while paying this
Step 2: Get Your Full Employer 401k Match
This is free money—typically a 50% to 100% instant return on your contribution. If your employer matches 50% of your contributions up to 6% of your salary, and you’re not contributing enough to get the full match, you’re leaving thousands of dollars per year on the table.
Example of employer match value:
| Your Salary | Employer Match | You Contribute | Employer Adds | Total Annual | Free Money |
| $50,000 | 50% up to 6% | 6% ($3,000) | $1,500 | $4,500 | $1,500 |
| $75,000 | 50% up to 6% | 6% ($4,500) | $2,250 | $6,750 | $2,250 |
| $100,000 | 50% up to 6% | 6% ($6,000) | $3,000 | $9,000 | $3,000 |
Always get the full match before anything else. This is the single best investment decision you can make.
Step 3: Build a 12-Month Emergency Fund
This is part of the FinanceSwami Ironclad Retirement Planning Framework. I recommend keeping 12 months of essential living expenses in a high-yield savings account earning 4-5% interest. This fund is your safety net. It prevents you from being forced to sell investments during a market crash because you lost your job or had a medical emergency.
How to calculate your emergency fund target:
Add up your monthly essential expenses:
- Rent or mortgage payment
- Utilities (electric, water, gas, internet)
- Food and groceries
- Transportation (car payment, gas, insurance)
- Insurance (health, car, home)
- Minimum debt payments
- Essential spending only (not entertainment, dining out, etc.)
Multiply that monthly total by 12. That’s your target.
Emergency Fund Calculation Worksheet:
| Expense Category | Monthly Amount |
| Housing (rent/mortgage) | $_______ |
| Utilities | $_______ |
| Food/groceries | $_______ |
| Transportation | $_______ |
| Insurance | $_______ |
| Debt payments | $_______ |
| Other essentials | $_______ |
| Monthly Total | $_______ |
| 12-Month Target (×12) | $_______ |
If your essential expenses are $3,000 per month, you need $36,000 in your emergency fund.
Modified Approach for Impatient Investors:
I know $36,000 sounds like a lot. You don’t have to save it all before you start investing. Here’s a modified approach:
- Save $1,000 as a mini emergency fund
- Start getting your 401k match immediately
- Build emergency fund to 3-6 months of expenses
- Begin investing more aggressively while continuing to build toward full 12 months
- Complete full 12-month fund over next 2-3 years
This lets you start investing sooner while still building financial security.
Once you’ve completed this checklist—eliminated high-interest debt, gotten your employer match, and built at least a 3-6 month emergency fund—you’re ready to start investing seriously. These steps create the stable foundation that lets you invest confidently and avoid panicking during market downturns.
8. The FinanceSwami Ironclad Framework
Let me introduce you to the investment philosophy I teach and follow personally—what I call the FinanceSwami Ironclad Framework. This framework has two parts: the Retirement Planning Framework and the Investment Strategy Framework. Both work together to help you build substantial wealth while planning conservatively for retirement.
FinanceSwami Ironclad Retirement Planning Framework
This framework guides how I calculate retirement needs across all my retirement planning content. I call it “Ironclad” because it’s designed to hold up not just in best-case scenarios, but in real life, where inflation, healthcare, family needs, and surprises are normal.
Step 1: Build a 12-Month Rainy Day Fund (Non-Negotiable)
Before I even talk about retirement math, I want you stable today. Keep 12 months of essential living expenses in a rainy day fund. This fund prevents you from being forced to sell investments during downturns. It gives you breathing room during job loss, health events, family emergencies, or surprise expenses.
I treat this as a foundation step because retirement planning built on unstable ground is fragile. When you have a real safety net, you make better decisions and you invest with more patience.
Step 2: Reject the Traditional “70 Percent Rule”
You have probably heard the traditional advice: “You will need about 70 percent to 80 percent of your pre-retirement income to live comfortably in retirement.”
The logic sounds reasonable on the surface. You are no longer saving for retirement, you are not commuting to work, your mortgage might be paid off, and your tax bracket could be lower.
Here’s my honest take: I think this advice is dangerously optimistic and sets many people up for financial stress in their later years.
Yes, some expenses may go down in retirement. But many critical expenses go up—often by more than people expect.
Step 3: Understand What Actually Goes Up in Retirement
When I talk to people approaching or already in retirement, the same themes come up again and again:
Healthcare costs – As you age, you typically visit doctors more frequently, need more prescriptions, and face higher out-of-pocket costs. Even with Medicare, premiums, copays, deductibles, and uncovered services add up quickly. Fidelity has estimated that a retired couple may need hundreds of thousands of dollars just for healthcare expenses over retirement.
Insurance costs – Many retirees end up paying more for Medicare supplemental plans, prescription drug coverage, and long-term care insurance (if they choose it). These costs rarely move down over time.
Home and vehicle maintenance – Homes and cars age just like people do. Expect roof replacements, HVAC systems, plumbing issues, appliance failures, and vehicle repairs or replacements. These are large, irregular expenses that do not show up neatly in “average retirement budgets.”
Service costs – Tasks you once handled yourself—lawn care, snow removal, cleaning, basic repairs—often become paid services later in life. These costs are easy to underestimate but very real.
Inflation over long retirement horizons – Retirement is not a 10-15 year phase anymore. Many people will spend 25-35 years in retirement. Over that time, prices rise, taxes may rise, and healthcare inflation often outpaces general inflation. What costs $40,000 per year today could easily cost $80,000 or more in a couple of decades.
Step 4: Use the FinanceSwami 3-Scenario Expense Model
Instead of assuming expenses will drop by 30 percent, I recommend planning using three scenarios—and aiming for the third:
Scenario 1: Current lifestyle baseline (minimum)
At minimum, assume you will need 100 percent of your current annual living expenses in retirement. Not 70 percent. Not 80 percent. 100 percent. This accounts for the fact that some categories go down, but others go up, and it often balances out.
Scenario 2: The realistic buffer (25 percent more)
Plan for 25 percent more than your current expenses.
Example:
- Current spending: $40,000 per year
- Retirement target: $50,000 per year
This buffer gives you breathing room for healthcare, maintenance, and unexpected expenses.
Scenario 3: The ironclad plan (50 percent more) – my recommendation
This is what I want most people to aim for. Plan for 50 percent more than your current annual expenses.
Example:
- Current spending: $40,000 per year
- Retirement target: $60,000 per year
Why this works:
- Covers major medical events and higher out-of-pocket costs
- Absorbs insurance premium increases
- Handles large, irregular expenses (roof, HVAC, big repairs)
- Allows generosity toward family when life happens
- Protects against inflation over decades
- Reduces financial anxiety in your 70s and 80s
I would much rather you over-prepare and enjoy retirement than under-prepare and spend your later years worrying about money.
Step 5: Plan for a 35-Year Retirement Horizon (Not 25)
Many models assume a 25-year retirement. I prefer planning for 35 years, because people are living longer, medical advances extend lifespan, and running out of money late in life is far worse than having extra. This longer horizon builds margin into the plan.
Step 6: Use the 4 Percent Rule as a Starting Point (Not a Promise)
Once you estimate annual retirement spending, you can work backward. The 4 percent rule suggests that withdrawing about 4 percent of your portfolio annually (and adjusting for inflation over time) has historically supported around 30 years of retirement. It is not a guarantee—it is a starting point for planning.
Example using Scenario 3 (ironclad target):
- Target retirement spending: $60,000 per year
- Expected Social Security: $20,000 per year
- Needed from savings: $40,000 per year
- Using the 4 percent rule: $40,000 ÷ 0.04 = $1,000,000
That is an approximate target—not a promise. But it gives you a clear goal to work toward.
FinanceSwami Ironclad Investment Strategy Framework
This framework guides the actual investing process—what to buy, when, and how to structure your portfolio.
Priority #1: Maximize Tax-Advantaged Accounts
The framework prioritizes tax-advantaged accounts in this specific order:
- 401k up to employer match – Free money, instant 50-100% return
- Roth IRA maximum – $7,000/year ($8,000 if 50+), tax-free growth forever
- 401k maximum – $23,500/year ($31,000 if 50+), tax-deferred growth
- HSA if available – Triple tax advantage, invest it like an IRA
- Taxable brokerage – After maxing all tax-advantaged space
Priority #2: First $50,000 in Low-Cost Index Funds
For your first $50,000 invested, keep it simple. I recommend a two-fund approach:
- 70% in VOO (Vanguard S&P 500 ETF) or FXAIX (Fidelity 500 Index Fund)
- 30% in QQQM (Invesco Nasdaq-100 ETF) or VGT (Vanguard Information Technology ETF)
This gives you 100% stock allocation with broad diversification across 600 companies and very low fees (0.03% and 0.15% respectively).
Priority #3: Shift from Growth to Dividend Focus as You Age
As your portfolio grows beyond $50,000 and you age past 35-40, begin shifting within stocks from pure growth focus to dividend-paying stocks. Add funds like:
- SCHD (Schwab U.S. Dividend Equity ETF) – Focus on dividend growth
- VYM (Vanguard High Dividend Yield ETF) – Broad dividend coverage
- JEPI (JPMorgan Equity Premium Income ETF): ~8-10% yield
- JEPQ (JPMorgan Nasdaq Equity Premium Income ETF): ~10-11% yield
- Individual quality dividend stocks – After building foundation
By age 50-55, your portfolio should be heavily dividend-focused—50% to 70% in dividend-paying stocks and REITs that generate substantial income.
Priority #4: Maintain High Stock Allocation (85-100%) Across All Ages
This is where FinanceSwami differs from traditional advice:
| Age | Traditional Advice | FinanceSwami Allocation |
| 25-40 | 70-80% stocks / 20-30% bonds | 100% stocks (growth-focused) |
| 41-55 | 60-70% stocks / 30-40% bonds | 100% stocks (shifting to dividend) |
| 56-64 | 50-60% stocks / 40-50% bonds | 90-95% stocks / 5-10% bonds |
| 65+ | 30-40% stocks / 60-70% bonds | 85% stocks / 15% bonds |
The framework maintains high stock allocation (85-100%) across all ages. This differs from traditional advice that shifts heavily to bonds as you age. Instead, I recommend shifting within stocks—from growth stocks to dividend-paying stocks—rather than to bonds.
Why this works: Quality dividend stocks provide income like bonds while also offering growth potential and inflation protection. According to research on dividend aristocrats (companies with 25+ years of consecutive dividend increases), these stocks have historically provided both stable income and capital appreciation, making them superior to bonds for most investors.
Priority #5: Add Bonds Sparingly
- 0% bonds until age 55
- 5-10% bonds from ages 55-64
- Maximum 10-15% bonds at age 65 and beyond
Quality dividend-paying stocks can serve the role bonds traditionally filled—providing income—while also offering growth and inflation protection that bonds don’t provide.
Priority #6: Apply Strict Diversification Guardrails
- No more than 5% of your portfolio in any single stock or bond
- For a few exceptional companies with strong balance sheets, global businesses, and durable profits (such as Google, Microsoft, or JPMorgan), you can hold up to 10% maximum—and no more
- Anything beyond that breaks diversification discipline
Priority #7: Review and Rebalance Systematically
You must review your portfolio periodically:
- Quarterly or semi-annually is sufficient
- This is not trading—this is stewardship of your money
- Markets change, weights drift, rebalancing may be required
This framework emphasizes patience, consistency, and conservative planning. It’s designed to help you build substantial wealth through simple, proven strategies while planning for a comfortable 35-year retirement with expenses at 100-150% of your current level.
9. Understanding Investment Accounts (401k, IRA, Taxable)
Before you can start investing, you need to understand the different types of accounts where you can hold your investments. This is one of the most confusing parts for beginners, so let me break it down simply.
The fundamental concept: The account is the container. The investment is what goes inside the container.
You can buy the same investments (like an S&P 500 index fund) in different types of accounts, but the tax treatment varies depending on which container you use.
Employer-Sponsored Retirement Accounts (401k, 403b)
Your 401k is a retirement account offered by your employer. Money is taken directly from your paycheck before taxes, which reduces your taxable income for the year. The money grows tax-deferred, meaning you don’t pay taxes on gains until you withdraw in retirement. Many employers offer matching contributions—essentially free money that can double your contribution up to a certain percentage.
401k Contribution Limits (2024):
| Age | Maximum Contribution | With Catch-Up |
| Under 50 | $23,500 | N/A |
| 50-59 | $23,500 | $31,000 (+$7,500) |
| 60-63 | $23,500 | $34,750 (+$11,250 enhanced) |
| 64+ | $23,500 | $31,000 (+$7,500) |
Employer Match Example:
Let’s say your company offers a 50% match up to 6% of your salary:
| Your Salary | You Contribute (6%) | Employer Match (50% of 6%) | Total Annual | Free Money |
| $50,000 | $3,000 | $1,500 | $4,500 | $1,500 |
| $75,000 | $4,500 | $2,250 | $6,750 | $2,250 |
| $100,000 | $6,000 | $3,000 | $9,000 | $3,000 |
The huge advantage of a 401k is the employer match. If your company matches 50% of your contributions up to 6% of your salary, that’s a guaranteed 50% return before your money even gets invested. Always get the full employer match—it’s the single best investment decision you can make.
Pros of 401k:
- Immediate tax savings (contributions reduce current taxable income)
- Employer match (free money if offered)
- High contribution limits ($23,500-$34,750 annually)
- Automatic payroll deduction (set and forget)
Cons of 401k:
- Limited investment options (whatever employer offers)
- Can’t withdraw before 59½ without 10% penalty (except certain circumstances)
- Taxed as ordinary income in retirement
- Required Minimum Distributions at age 73
Individual Retirement Accounts (Traditional IRA and Roth IRA)
IRAs are retirement accounts you open yourself, not through an employer. You have complete control over where you open the account (Fidelity, Vanguard, Schwab) and what investments you choose.
IRA Contribution Limits (2024):
| Age | Traditional IRA | Roth IRA |
| Under 50 | $7,000 | $7,000 |
| 50+ | $8,000 | $8,000 |
Traditional IRA works similarly to a 401k. You can deduct your contributions from your taxable income, the money grows tax-deferred, and you pay ordinary income taxes when you withdraw in retirement.
Roth IRA is different and, in my view, more powerful for most people. You contribute after-tax money (no immediate tax deduction), but the money grows completely tax-free forever. When you withdraw in retirement, you pay zero taxes—not on your contributions, not on your gains, nothing.
Roth IRA Income Limits (2024):
| Filing Status | Phase-Out Begins | Fully Phased Out |
| Single | $146,000 | $161,000 |
| Married Filing Jointly | $230,000 | $240,000 |
If you earn more than these amounts, you can use a “backdoor Roth” strategy, which involves contributing to a Traditional IRA and immediately converting it to a Roth IRA.
Roth IRA vs. Traditional IRA – 30 Year Comparison:
Let’s see the power of tax-free growth:
| Scenario | Annual Contribution | Years | Total Contributed | Value at Retirement | Taxes Owed | Net After Taxes |
| Traditional IRA | $7,000 | 30 | $210,000 | $1,217,000 | ~$365,000 (30%) | $852,000 |
| Roth IRA | $7,000 | 30 | $210,000 | $1,217,000 | $0 | $1,217,000 |
| Difference | Same | Same | Same | Same | $365,000 saved | +$365,000 |
Over a lifetime, Roth IRA can save you $300,000-$500,000+ in taxes.
According to the FinanceSwami Ironclad Investment Strategy Framework, after getting your 401k match, maxing out your Roth IRA should be your next priority. The tax-free growth is incredibly powerful over decades.
Taxable Brokerage Accounts
A taxable brokerage account is a regular investment account with no special tax treatment. You can invest as much money as you want with no annual limits. You have complete flexibility—you can withdraw money anytime without penalties or age restrictions. However, you pay capital gains tax when you sell investments for a profit, and you pay taxes on dividends annually.
Tax Rates on Investments (2024):
| Income Level (Single) | Long-Term Capital Gains Rate | Short-Term Capital Gains | Qualified Dividends |
| $0-$47,025 | 0% | Ordinary rate | 0% |
| $47,026-$518,900 | 15% | Ordinary rate | 15% |
| $518,901+ | 20% | Ordinary rate | 20% |
When to use taxable accounts:
- After maxing out tax-advantaged accounts ($30,500+ annually in 401k + IRA)
- For goals before retirement (house down payment in 10 years, etc.)
- When you want flexibility to access money without penalties
Account Priority System (Critical)
Here’s the exact order you should prioritize accounts, according to the FinanceSwami Ironclad Investment Strategy Framework:
Investment Account Priority Checklist:
□ Priority 1: 401k up to employer match (if your company matches up to 6%, contribute 6%)
□ Priority 2: Pay off high-interest debt (credit cards, loans above 8%)
□ Priority 3: Build emergency fund (12 months of expenses in high-yield savings)
□ Priority 4: Max out Roth IRA ($7,000/year, or $583/month)
□ Priority 5: Return to 401k and max it out ($23,500/year total)
□ Priority 6: Max out HSA if available ($4,150 individual / $8,300 family)
□ Priority 7: Invest in taxable brokerage account (unlimited contributions)
Complete Priority Example:
Let’s say you’re 30 years old, earn $75,000/year, and your employer matches 50% up to 6%:
| Priority | Account | Annual Amount | Monthly Amount | Cumulative Annual |
| 1 | 401k (match) | $4,500 | $375 | $4,500 |
| Employer adds | $2,250 | $6,750 | ||
| 4 | Roth IRA | $7,000 | $583 | $13,750 |
| 5 | 401k (additional) | $5,500 | $458 | $19,250 |
| Total invested | $17,000 | $1,416 | $21,500 (with match) |
This priority system maximizes tax advantages and free money (employer match). Following this sequence will save you tens or hundreds of thousands of dollars in taxes over your lifetime.
10. Why Index Funds Are Perfect for Beginners
Let me explain why index funds should form the foundation of every beginner investor’s portfolio.
An index fund is a type of investment fund designed to match the performance of a specific market index, like the S&P 500. When you buy an S&P 500 index fund, you’re buying tiny pieces of all 500 companies in that index at once. One purchase gives you instant ownership in Apple, Microsoft, Amazon, Google, Tesla, Walmart, JPMorgan Chase, and 493 other major American companies.
The Case for Index Funds: Research and Performance
Here’s a fact that shocks most people: Over any 15-20 year period, about 85-90% of professional fund managers FAIL to beat a simple S&P 500 index fund.
These are people with MBA degrees from Harvard and Wharton, decades of experience, massive research teams, Bloomberg terminals costing $25,000/year, inside access to company executives, and billion-dollar budgets. And they can’t beat a simple index fund that costs $3 per year per $10,000 invested.
SPIVA (S&P Indices Versus Active) Report Findings:
| Time Period | % of Active Funds That Underperformed S&P 500 |
| 1 year | 60% |
| 5 years | 75% |
| 10 years | 85% |
| 15 years | 90% |
| 20 years | 95% |
According to the S&P Dow Jones Indices SPIVA report, the longer you invest, the more certain it is that index funds will outperform actively managed funds. If professionals can’t beat index funds, what chance do beginners have picking individual stocks? Almost none.
The Math Behind Why Index Funds Wind
It’s not that index funds have better stock picking. It’s that they have dramatically lower costs, and those costs compound against you over decades.
Cost Comparison Over 30 Years:
| Investment | Initial Amount | Gross Return | Expense Ratio | Net Return | Value After 30 Years | Cost of Fees |
| Index Fund (VOO) | $100,000 | 10% | 0.03% | 9.97% | $1,738,000 | $68,000 |
| Active Fund (Average) | $100,000 | 10% | 1.00% | 9.00% | $1,327,000 | $479,000 |
| Expensive Active Fund | $100,000 | 10% | 2.00% | 8.00% | $1,006,000 | $800,000 |
Same starting amount. Same gross returns. The only difference is fees. That 1% fee difference costs $411,000 over 30 years. A 2% fee costs $800,000.
Warren Buffett’s Famous Bet:
In 2007, Warren Buffett made a famous bet with hedge funds. He wagered $1 million that an S&P 500 index fund would beat a collection of hedge funds over 10 years (2008-2017). Five hedge funds accepted the challenge.
Results after 10 years:
| Investment | 10-Year Return |
| S&P 500 Index Fund | 125.8% |
| Average of 5 Hedge Funds | 36.3% |
The simple index fund more than tripled the hedge fund returns. Buffett’s conclusion: “Both large and small investors should stick with low-cost index funds.”
Why Index Funds Are Perfect for Beginners
Reason #1: Instant Diversification
S&P 500 Index Fund gives you:
- 500 companies across all 11 sectors
- Trillions in market value
- America’s best businesses
- Automatic risk reduction
If Apple crashes, you own 499 other companies. If tech sector struggles, you own healthcare, energy, finance, consumer goods, utilities, and more. No single company failure can destroy your portfolio.
Compare this to buying individual stocks yourself. If you pick 5 stocks and one fails completely (drops to $0), you’ve lost 20% of your portfolio. With an index fund, one company failure barely registers.
Reason #2: Extremely Low Costs
Index Fund Expense Ratios:
| Fund Name | Ticker | Expense Ratio | Cost on $10,000 | Cost on $100,000 |
| Vanguard S&P 500 | VOO | 0.03% | $3/year | $30/year |
| Fidelity 500 Index | FXAIX | 0.015% | $1.50/year | $15/year |
| Schwab S&P 500 | SWPPX | 0.02% | $2/year | $20/year |
| Invesco Nasdaq-100 | QQQM | 0.15% | $15/year | $150/year |
These are almost free. And over decades, low costs compound to hundreds of thousands in savings.
Reason #3: Zero Research Required
Picking individual stocks requires:
- Reading financial statements (balance sheets, income statements, cash flow)
- Understanding competitive advantages and moats
- Analyzing management quality and corporate governance
- Tracking industry trends and disruption threats
- Monitoring quarterly earnings and guidance
- Knowing when to sell (hardest decision)
Hours and hours of research for each stock. Most beginners don’t have this expertise.
Index funds require:
- Buy VOO
- Hold forever
- That’s it
Zero research needed. Zero expertise needed. The index handles everything automatically.
Reason #4: Automatic Rebalancing
The index does the work for you:
- Companies grow → their weight in index increases automatically
- Companies shrink → their weight decreases automatically
- Companies fail → removed from index, replaced with growing company
- You do nothing
Example: Kodak was huge in 1980, part of the S&P 500. By 2012, Kodak went bankrupt and was removed from the index. A new growing company was added automatically. Index fund holders weren’t affected—they seamlessly transitioned from failing Kodak to the growing replacement.
This automatic “survival of the fittest” is built into index funds.
Reason #5: Proven Long-Term Performance
S&P 500 Historical Returns:
| Time Period | Average Annual Return |
| Since 1926 | ~10.0% |
| Last 50 years | ~10.5% |
| Last 30 years | ~10.7% |
| Last 20 years | ~9.8% |
| Last 10 years | ~12.5% |
Remarkably consistent around 10% annually over long periods. This return has survived:
- Great Depression (1929-1939)
- World War II (1939-1945)
- 1970s stagflation and oil crisis
- Black Monday crash (1987)
- Dot-com bubble burst (2000-2002)
- Financial crisis (2008-2009)
- COVID crash (2020)
Markets crash. Markets recover. Index funds keep compounding.
FinanceSwami Recommended Index Funds
According to the FinanceSwami Ironclad Investment Strategy Framework, your first $50,000 should be invested in simple, low-cost index funds:
Core Holding #1: VOO or FXAIX (S&P 500 Index)
- Allocation: 70% of portfolio
- Tracks: 500 largest U.S. companies
- Expense ratio: 0.03% (VOO) or 0.015% (FXAIX)
- Use: Foundation of every portfolio
Core Holding #2: QQQM or VGT (Growth Index)
- Allocation: 30% of portfolio
- QQQM tracks: Nasdaq-100 (tech-heavy)
- VGT tracks: Information Technology sector
- Expense ratio: 0.15% (QQQM) or 0.10% (VGT)
- Use: Growth exposure when young (under 40)
As You Age and Build Wealth, Add:
Dividend Focus: SCHD (Schwab U.S. Dividend Equity)
- Add starting age 35-40
- Focus: High-quality dividend growth stocks
- Expense ratio: 0.06%
- Increase allocation to 30-60% by retirement
Dividend Alternative: VYM (Vanguard High Dividend Yield)
- Broader dividend coverage
- Expense ratio: 0.06%
- Complements SCHD well
With 2-4 of these funds, you can build a complete portfolio for life. You can also look at high dividend paying funds (managed by J.P. Morgan) such as JEPQ and JEPI that on average pays 7-11% distribution. Simple, boring, proven, and effective—exactly what you want when building wealth.
11. Step-by-Step: How to Start Investing Today
Let me walk you through the exact process of starting to invest, step by step. By the end of this section, you’ll know exactly what to do.
Step 1: Open a Roth IRA at a Reputable Brokerage
Choose one of three brokerages:
| Brokerage | Best For | Strengths |
| Fidelity | Beginners | Excellent customer service, best mobile app, great research tools |
| Vanguard | Cost-conscious | Pioneer of index investing, rock-bottom fees, investor-owned |
| Schwab | Banking integration | Great app, ATM reimbursement, checking+investing in one place |
All three are excellent, have zero account minimums, charge no commissions, and offer the index funds I recommend. You can’t go wrong with any of them.
Opening a Roth IRA – Exact Steps:
- Go to fidelity.com, vanguard.com, or schwab.com
- Click “Open an Account”
- Select “Retirement” → “Roth IRA”
- Click “Continue”
Information you’ll need:
- Full legal name
- Home address
- Date of birth
- Social Security number
- Employment information (employer name, occupation)
- Estimated annual income
- Beneficiary information (who gets account if you die)
Time required: 15-20 minutes
Once submitted, approval is usually immediate. You’ll receive an account number and can begin funding the account.
Step 2: Link Your Bank Account and Fund Your Roth IRA
After your account is approved, you need to link your checking account to transfer money.
Bank Linking Process:
- Navigate to “Transfers” or “Move Money”
- Select “Link External Bank Account”
- Enter your bank’s routing number (9 digits)
- Enter your account number
- Verify ownership (brokerage deposits $0.23 and $0.47 to confirm)
- Wait 2-3 business days for verification
Initial Funding Amount:
For 2024, you can contribute up to $7,000 per year to a Roth IRA if you’re under 50, or $8,000 if you’re 50 or older.
You don’t have to deposit the full amount immediately. Start with whatever you have:
- $500 minimum to feel real
- $1,000-$3,000 comfortable start
- $5,000-$7,000 ideal if available
After verification, transfer your initial investment amount from checking to Roth IRA.
Step 3: Buy Your First Investments
Once money is in your account, you’re ready to buy your first index funds.
Purchasing VOO (S&P 500 Index Fund):
- Log into your account
- Navigate to “Trade” or “Buy/Sell”
- Enter ticker symbol: VOO
- Verify: “Vanguard S&P 500 ETF” (Expense ratio: 0.03%)
- Select “Buy”
- Choose order type: Market order (buys at current price)
- Enter amount:
- Dollar amount: $700 (if investing $1,000 and using 70/30 split)
- Or number of shares: 1.5 shares (most brokerages allow fractional shares)
- Review order details
- Submit order
- Confirmation appears (executes within seconds during market hours)
Market Hours: 9:30 AM – 4:00 PM Eastern Time, Monday-Friday (excluding holidays)
Purchasing QQQM (Nasdaq-100 Index Fund):
Repeat the same process:
- Search ticker: QQQM
- Verify: “Invesco Nasdaq-100 ETF” (Expense ratio: 0.15%)
- Buy $300 (if investing $1,000 and using 70/30 split)
- Submit order
Your first investment is complete. You now own pieces of 600 of America’s best companies.
When evaluating investment options, pay close attention to management fees and expense ratios, as these costs compound over time just like returns. An investment product charging 1% annual fees costs you approximately $10,000 in fees over 30 years on a $100,000 investment, while a fund charging 0.05% costs only $500 in fees over the same period. This is why the Ironclad Framework emphasizes low-cost index funds – the fee savings alone makes them superior to most actively managed funds. When you buy or sell investments, most brokerages now offer commission-free trading on stocks and ETFs, meaning you pay no transaction fee when placing orders. However, you’ll still execute at the market price, which is the current price at which the security is trading. For beginners, use “market orders” that execute immediately at the current market price rather than limit orders, which only execute if the price reaches a specific level you set.
Step 4: Set Up Automatic Monthly Contributions (Critical)
This is the most important step. You want investing to become completely automatic—as automatic as paying your phone bill.
Setting Up Recurring Transfers:
- Navigate to “Transfers” → “Automatic Transfers”
- Configure transfer:
- From: Your linked checking account
- To: Your Roth IRA
- Amount: $583/month (to reach $7,000 annual max)
- Or whatever amount you can afford ($200, $500, $1,000/month)
- Frequency: Monthly
- Day: 1st of month (or day after your paycheck)
- Start date: Next month
- Save and activate
Setting Up Automatic Investments:
- Navigate to “Account Features” → “Automatic Investments”
- Configure investments:
- VOO: 70% of all deposits
- QQQM: 30% of all deposits
- Activate automatic investing
Now it’s completely automated:
- Every month: $583 transfers from checking to Roth IRA automatically
- Same day: Money automatically invests into VOO (70%) and QQQM (30%)
- You never have to think about it
Automatic Investment Worksheet:
| Account | Monthly Amount | Allocation | Amount to VOO (70%) | Amount to QQQM (30%) |
| Roth IRA | $583 | 70/30 | $408 | $175 |
| Roth IRA | $300 | 70/30 | $210 | $90 |
| Roth IRA | $1,000 | 70/30 | $700 | $300 |
Fill in your numbers and set up accordingly.
Step 5: Enroll in Your Employer’s 401(k)
If your employer offers a 401(k) with matching contributions, enroll immediately.
401(k) Enrollment Steps:
- Contact HR department or log into benefits portal
- Enroll in 401(k) plan
- Choose contribution percentage:
- Minimum: Enough to get full match (often 6%)
- Target: 10-15% of salary
- Maximum: $23,500/year ($1,958/month)
- Select investments from employer’s options
Finding the Best Fund in Your 401(k):
Look for these fund characteristics:
- Name includes “S&P 500”, “500 Index”, or “Large Cap Index”
- Expense ratio under 0.10% (ideally under 0.05%)
- Passively managed (not actively managed)
Common 401(k) fund names:
- Fidelity: “FXAIX” or “Fidelity 500 Index Fund”
- Vanguard: “VFIAX” or “Vanguard 500 Index Admiral”
- State Street: “SPTMX” or similar
- Target-Date Funds: “Target Date 2050 Fund” (if confused, use this)
If you can’t find a good low-cost index fund, choose the target-date fund that corresponds to your expected retirement year (2050, 2055, 2060, etc.).
Step 6: Set an Annual Review Reminder
Put a reminder in your calendar for December 31st each year. This is your annual portfolio review date.
Annual Review Checklist (30 minutes once per year):
□ Log into all accounts (401k, Roth IRA, taxable)
□ Check current allocation percentages
□ Rebalance if any fund is off by 5%+ from target
□ Adjust contribution amounts if income changed
□ Review if allocation still appropriate for age
□ Update beneficiaries if life circumstances changed
That’s it—once per year, 30 minutes of your time.
Complete Implementation Timeline
Week 1:
- Open Roth IRA (20 minutes)
- Link bank account (5 minutes)
- Wait for verification (2-3 days)
Week 2:
- Transfer initial investment
- Buy VOO and QQQM (10 minutes)
- Set up automatic monthly contributions (10 minutes)
- Set up automatic investments (5 minutes)
Week 3:
- Enroll in 401(k) if available (20 minutes)
- Select investments in 401(k) (10 minutes)
Week 4:
- Set December 31 review reminder
- Relax—you’re done
Total time investment: 2-3 hours to set up everything
Ongoing time: 30 minutes per year for annual review
That’s the complete process. Within one week, you can go from never having invested a dollar to having a fully automated investment system that will build wealth for decades.
12. Working with a Financial Advisor: When and How
Many beginners wonder whether they need a financial advisor to start investing, or if they should go it alone. The honest answer is: it depends on your situation, your confidence level, and how much guidance you actually need versus how much you think you need.
What a Financial Advisor Actually Does
A financial advisor helps you create an investment strategy, choose appropriate investments, and stay on track with your financial goals. They can help you clarify your investment goal, whether that’s retirement at 65, financial independence at 50, or funding your children’s education. But here’s what many people don’t realize: there are different types of advisors, and they work very differently.
Fee-Only Fiduciary Advisors: These advisors charge you directly (either a flat fee, hourly rate, or percentage of assets) and are legally required to act in your best interest. They don’t earn commissions from selling you products, which eliminates the conflict of interest that exists with commission-based advisors. A fee-only advisor might charge $150-400/hour for consultation, or 0.5-1.5% of assets under management annually.
Commission-Based Advisors: These advisors earn money by selling you investment products – mutual funds, insurance products, annuities. While some are ethical and genuinely helpful, the inherent conflict of interest means they may recommend products that earn them higher commissions rather than what’s truly best for you. This is the category where you need to be most cautious.
When You DON’T Need a Financial Advisor
If you’re following the FinanceSwami Ironclad Framework – building emergency fund, then investing your first $50,000 in simple index funds through tax-advantaged accounts – you genuinely do not need a financial advisor. This strategy is straightforward enough that you can implement it yourself with the information in this guide.
You can successfully begin investing on your own if you commit to:
- Following a simple strategy (like the Ironclad Framework) consistently
- Not panicking during market downturns
- Automating contributions so emotion doesn’t derail you
- Ignoring market noise and staying the course
When a Financial Advisor Makes Sense
Working with a financial advisor becomes genuinely valuable in these situations:
Complex financial situation: You’re self-employed with variable income, you have multiple income streams, you’re managing a business alongside personal investments, or you have substantial assets (over $500,000) requiring tax optimization and estate planning. In these cases, the tax strategies, business structure advice, and comprehensive planning an advisor provides can easily justify their fee.
Behavioral coaching need: You know yourself well enough to recognize that you’ll panic-sell during market downturns, chase hot investment trends, or make emotional decisions with your money. Some people need external accountability to stay disciplined. If that’s you, an advisor who keeps you from sabotaging your own plan can be worth the cost.
The DIY Path for Most Beginners
For most people reading this guide – especially if you’re in the early stages of building wealth with under $100,000 to invest – the DIY approach following the FinanceSwami Ironclad Framework will serve you well. You don’t need professional help to open a Roth IRA, buy a target-date fund or index fund, and contribute consistently. These are straightforward actions that billions of dollars in financial advisor fees have been charged for, when the reality is most beginners can execute them successfully on their own.
As your wealth grows and your financial situation becomes more complex – maybe you’re approaching retirement, managing substantial assets, or dealing with business ownership and estate planning – that’s when a financial advisor’s expertise becomes genuinely valuable. But for building your first $50,000-100,000 in index funds? You can do this yourself.
13. Understanding Risk and Your Risk Tolerance
Let me explain what risk actually means in investing and how to figure out how much risk you can handle.
When most people hear “investing is risky,” they think about losing all their money. That’s not how stock market risk actually works for diversified investors using index funds. The real risk is volatility—your investments going up and down in value—not permanent loss of your money.
What Risk Really Means in Investing
Risk in investing has two components:
Short-term volatility: Your portfolio value bouncing around from month to month and year to year. In any given year, stocks might be up 25% or down 15%. This volatility is normal and expected.
Long-term risk: The risk that your money won’t grow enough over decades to meet your goals. Paradoxically, being too conservative (keeping everything in savings accounts) creates more long-term risk than investing in stocks because inflation eats away your purchasing power.
Historical Stock Market Volatility
Let me show you what “normal” volatility looks like:
S&P 500 Annual Returns (Selected Years):
| Year | Return | Experience |
| 2013 | +32% | Excellent year |
| 2014 | +14% | Good year |
| 2015 | +1% | Basically flat |
| 2016 | +12% | Good year |
| 2017 | +22% | Excellent year |
| 2018 | -4% | Slight loss |
| 2019 | +31% | Excellent year |
| 2020 | +18% | Good year (despite COVID) |
| 2021 | +29% | Excellent year |
| 2022 | -18% | Bad year |
| 2023 | +26% | Excellent year |
Notice the pattern: Some years are up big. Some years are down. But over long periods, the trend is strongly positive. Over these 11 years, the average return was about 14% annually despite a -18% year mixed in.
Frequency of Positive vs. Negative Years:
According to research analyzing 98 years of S&P 500 data (1926-2023):
| Outcome | Frequency | Percentage |
| Positive years | 73 out of 98 | 74% |
| Negative years | 25 out of 98 | 26% |
| Negative years over -10% | 15 out of 98 | 15% |
| Negative years over -20% | 9 out of 98 | 9% |
Translation: Stocks go up about three-quarters of the time. They go down about one-quarter of the time. Big crashes (over -20%) happen roughly once per decade.
The Risk-Return Relationship
There’s a fundamental trade-off in investing: higher potential returns come with higher volatility. You can’t have one without the other.
Risk vs. Return by Asset Class:
| Investment | Expected Annual Return | Typical Volatility | Maximum Historical Drawdown |
| Cash/Savings | 3-5% | Almost none | 0% |
| Bonds | 5-6% | Low | -8% |
| Stocks | 10% | High | -43% (Great Depression) |
| Aggressive stocks | 11-12% | Very high | -50% (various crashes) |
You have to choose where you want to be on this spectrum. Want very safe? Accept 3-5% returns (which barely beats inflation). Want 10% returns? Accept that some years will be down 20-30%.
Risk Tolerance Quiz
Answer these questions honestly to understand your personal risk tolerance:
Question 1: Your portfolio drops 20% in a single month. You:
- A) Panic and sell everything to stop the bleeding
- B) Feel very uncomfortable but force yourself to stay invested
- C) See it as a buying opportunity and invest more
Question 2: During the COVID crash (March 2020), you:
- A) Sold some or all of your investments
- B) Held steady and tried not to look at your account
- C) Bought more stocks when prices dropped
Question 3: Your ideal investment result would be:
- A) 5-6% returns with minimal ups and downs
- B) 8-9% returns with moderate volatility
- C) 10%+ returns even with large swings
Question 4: You check your investment accounts:
- A) Daily or multiple times per week
- B) Monthly or quarterly
- C) Annually or when making contributions
Question 5: Your emergency fund status:
- A) Less than 6 months of expenses saved
- B) 6-12 months of expenses saved
- C) 12+ months of expenses saved (FinanceSwami recommendation)
Question 6: Your investment knowledge:
- A) Beginner – just learning the basics
- B) Intermediate – understand core concepts
- C) Advanced – have invested through multiple market cycles
Scoring:
- Mostly A’s: Conservative risk tolerance
- Mostly B’s: Moderate risk tolerance
- Mostly C’s: Aggressive risk tolerance
Risk Tolerance vs. Risk Capacity
There’s an important distinction between tolerance (emotional willingness to accept risk) and capacity (financial ability to take risk):
Risk tolerance = willingness to take risk (emotional)
Risk capacity = ability to take risk (financial)
You need both to take significant investment risk.
Example scenarios:
| Scenario | Tolerance | Capacity | What to Do |
| Young, calm investor | High | High | Aggressive (100% stocks) |
| Young, nervous investor | Low | High | Moderate (80% stocks) |
| Retiree, calm investor | High | Low | Conservative (60% stocks) |
| Retiree, nervous investor | Low | Low | Very conservative (40% stocks) |
The more restrictive factor determines your appropriate allocation. If you have high capacity but low tolerance, let tolerance win—you need an allocation you can actually stick with during crashes.
The Danger of Overestimating Risk Tolerance
Many people think they’re aggressive investors until they experience their first major crash. Let me show you what that feels like in real dollar terms:
Portfolio Crash Scenarios:
Imagine you have $100,000 invested and the market drops 30% (which happens roughly once per decade):
| Allocation | Portfolio Drops To | Dollar Loss | Emotional Impact |
| 100% stocks | $70,000 | -$30,000 | Severe anxiety |
| 80% stocks / 20% bonds | $76,000 | -$24,000 | High stress |
| 60% stocks / 40% bonds | $82,000 | -$18,000 | Moderate concern |
Now imagine that’s not $100,000 but $500,000:
| Allocation | Portfolio Drops To | Dollar Loss | Emotional Impact |
| 100% stocks | $350,000 | -$150,000 | Panic-inducing |
| 80% stocks / 20% bonds | $380,000 | -$120,000 | Very difficult |
| 60% stocks / 40% bonds | $410,000 | -$90,000 | Uncomfortable but manageable |
Can you watch $150,000 disappear without selling? If not, you’re not actually an aggressive investor. And that’s okay—it’s better to use an allocation you can stick with than a theoretically optimal allocation you’ll abandon during a crash.
According to research on investor behavior during the 2008 financial crisis, investors who had “aggressive” allocations of 90-100% stocks were much more likely to panic-sell at the bottom (approximately 40-50% sold) compared to investors with moderate 60-70% stock allocations (approximately 15-20% sold).
Matching Allocation to Risk Tolerance
According to the FinanceSwami Ironclad Investment Strategy Framework, here’s how risk tolerance adjusts the baseline age-appropriate allocation:
Age 35 Example:
| Risk Profile | FinanceSwami Base | Adjustment | Final Allocation |
| Conservative | 100% stocks | Add 10-15% bonds | 85-90% stocks |
| Moderate | 100% stocks | No change | 100% stocks |
| Aggressive | 100% stocks | No change | 100% stocks |
Age 55 Example:
| Risk Profile | FinanceSwami Base | Adjustment | Final Allocation |
| Conservative | 90-95% stocks | Add 5-10% more bonds | 80-85% stocks |
| Moderate | 90-95% stocks | Use base | 90-95% stocks |
| Aggressive | 90-95% stocks | Use base | 95-100% stocks |
Age 65+ Example:
| Risk Profile | FinanceSwami Base | Adjustment | Final Allocation |
| Conservative | 85% stocks / 15% bonds | Add 10% more bonds | 75/25 |
| Moderate | 85% stocks / 15% bonds | Use base | 85/15 |
| Aggressive | 85% stocks / 15% bonds | Reduce bonds | 90/10 |
Key principle: Even conservative investors in the FinanceSwami framework maintain 75-90% stocks across all ages—we just shift within stocks from growth to dividend focus, and add minimal bonds for psychological comfort.
The Most Important Risk Lesson
The biggest investment risk isn’t market crashes. Crashes are temporary. Markets have recovered from every single crash in history.
The biggest risk is your behavioral response to crashes. Panic-selling during a downturn locks in losses permanently. According to a famous study by Dalbar, Inc., the average investor earned only 3.9% annually over a 20-year period (1994-2013) when the S&P 500 averaged 9.2% annually—a gap of 5.3% per year caused primarily by panic-selling during downturns and buying back in after recoveries.
Your allocation should be conservative enough that you can stay invested during crashes. An investor who stays in a moderate 70/30 allocation through all market cycles will build far more wealth than one who picks an aggressive 100/0 allocation, panics during the first crash, and sells at the bottom.
Discipline beats optimization.
14. Common Investing Strategies for Beginners
Let me walk you through the most effective investing strategies for beginners—approaches that are simple, proven, and don’t require constant attention.
Strategy #1: Dollar-Cost Averaging (Buy Regularly No Matter What)
Dollar-cost averaging means investing a fixed amount of money at regular intervals (monthly, for example) regardless of whether the market is up or down.
How it works:
You invest $500 every month on the 1st of the month. Some months the market is high, some months it’s low. Over time, you buy more shares when prices are low and fewer shares when prices are high. This averages out your cost per share.
Dollar-Cost Averaging Example:
| Month | Investment | Share Price | Shares Purchased |
| January | $500 | $100 | 5.0 shares |
| February | $500 | $90 | 5.6 shares |
| March | $500 | $80 | 6.3 shares |
| April | $500 | $95 | 5.3 shares |
| May | $500 | $110 | 4.5 shares |
| Total | $2,500 | Average: $95 | 26.7 shares |
If you had invested all $2,500 in January at $100/share, you’d have 25 shares. By spreading it out, you got 26.7 shares because you bought more during the dips.
Why this works:
- Removes emotion and timing from investing
- Ensures you buy during dips (when prices are low)
- Automatic and requires no decisions
- Reduces regret (you didn’t buy everything at the peak)
According to research comparing lump-sum investing vs. dollar-cost averaging, lump-sum investing wins about 66% of the time because markets go up more than they go down. However, for beginners who are nervous about investing a large sum all at once, dollar-cost averaging provides psychological comfort and ensures they actually start investing rather than waiting indefinitely for “the perfect time.”
FinanceSwami approach: Dollar-cost average through automatic monthly contributions. Set it up once and never think about it again.
Strategy #2: Buy and Hold (Long-Term Investing)
Buy and hold means purchasing investments and holding them for years or decades regardless of short-term market movements.
The strategy:
- Buy quality index funds (VOO, QQQM)
- Hold for 10, 20, 30+ years
- Ignore daily/monthly/yearly fluctuations
- Only check portfolio 1-2 times per year
- Never try to time the market
Why this works:
According to research by Fidelity analyzing investor accounts, investors who had the best portfolio performance fell into one category: investors who forgot they had accounts. Dead investors and people who forgot about their accounts outperformed active investors who checked frequently and made trading decisions.
Buy and Hold vs. Market Timing:
| Strategy | 30-Year Period | Average Return | Result |
| Buy and hold (stay invested entire time) | 1993-2022 | 9.8% annually | $1,000 → $17,000 |
| Missed 10 best days | 1993-2022 | 6.1% annually | $1,000 → $6,100 |
| Missed 20 best days | 1993-2022 | 4.3% annually | $1,000 → $3,600 |
Missing just the 10 best days in 30 years (which often occur during volatile periods when investors are scared) cuts your returns nearly in half. The problem: those best days are impossible to predict and often occur immediately after the worst days.
FinanceSwami approach: Buy index funds and hold them forever. Check once per year on December 31st. Otherwise, ignore them.
Strategy #3: Index Fund Investing (Own Everything)
Rather than picking individual stocks, buy index funds that own hundreds or thousands of companies at once. The reason index fund investing works so well for beginners is that it captures the full potential for growth of the overall market rather than betting on individual companies. When you invest in a total stock market index fund, you’re not trying to predict which companies will succeed – you’re accepting that some companies will fail, some will stagnate, but overall the economy grows and successful companies expand. This broad diversification ensures you capture the market’s potential for growth without the risk of picking the wrong individual stocks. Historical data shows that even professional fund managers struggle to beat index fund returns over 10-20 year periods, which is why the simple approach of buying and holding broad index funds remains the most reliable strategy for building long-term wealth.
The three-fund portfolio (simple and effective):
Many investors build wealth with just three funds:
| Fund Type | Allocation (Age 30) | Example |
| U.S. Stock Index | 70% | VOO (S&P 500) |
| Growth Stock Index | 20% | QQQM (Nasdaq-100) |
| Dividend Stock Index | 10% | SCHD/ JEPQ/ JEPI (Dividend Growth) |
As you age, shift allocation from growth to dividend, but keep it simple with 2-4 core holdings.
Why this works:
- Instant diversification (600+ companies)
- Extremely low fees (0.03%-0.15%)
- Beats 85-90% of professional investors over 15+ years
- Requires zero research or expertise
- Automatic rebalancing (index updates itself)
FinanceSwami approach: Build your entire portfolio with 2-4 index funds. More is not better. Simple wins.
Strategy #4: Tax-Loss Harvesting (Advanced Beginners)
Tax-loss harvesting means selling investments that have lost value to realize the loss for tax purposes, then immediately buying a similar (but not identical) investment to maintain your market exposure.
How it works:
Let’s say you bought VOO at $450/share and it’s now worth $400/share. You’re down $50/share. You:
- Sell VOO (realize $50/share loss)
- Immediately buy VTI (similar but not identical fund)
- Deduct the loss on your taxes (up to $3,000/year against ordinary income, unlimited against capital gains)
- Maintain same market exposure through VTI
Tax-Loss Harvesting Example:
| Action | Amount | Tax Benefit |
| Bought VOO | $10,000 (at $450/share) | – |
| VOO drops to $400/share | Now worth $8,889 | Loss: $1,111 |
| Sell VOO | $8,889 | Realized loss: $1,111 |
| Buy VTI immediately | $8,889 | Maintain market exposure |
| Tax deduction (25% bracket) | $1,111 loss | Save $278 in taxes |
Important rules:
- Must wait 30 days to buy back identical investment (wash sale rule)
- Can immediately buy similar investment (VOO → VTI is fine)
- Only valuable in taxable accounts (not in 401k or IRA)
- Best during market downturns
FinanceSwami approach: Use in taxable accounts during market crashes. Don’t overcomplicate it. Once per year during December is sufficient.
Strategy #5: Dividend Reinvestment (Compound Growth)
Dividend reinvestment means automatically using dividend payments to buy more shares rather than taking them as cash.
How it works:
You own 100 shares of SCHD paying a 3.5% dividend. Each year, you receive $350 in dividends (on $10,000 invested). Instead of taking the $350 as cash, you reinvest it to buy 3.5 more shares. Next year, you own 103.5 shares, which pay $362 in dividends, which buy 3.6 more shares, and so on.
Dividend Reinvestment Compounding:
| Year | Shares Owned | Annual Dividend | Reinvest Buys | End Shares |
| 1 | 100 | $350 | 3.5 shares | 103.5 |
| 5 | 118.3 | $414 | 4.1 shares | 122.4 |
| 10 | 140.7 | $492 | 4.9 shares | 145.6 |
| 20 | 197.9 | $693 | 6.9 shares | 204.8 |
| 30 | 278.3 | $974 | 9.7 shares | 288.0 |
Starting with 100 shares, after 30 years of dividend reinvestment, you own 288 shares—almost 3x more—without investing another dollar. Your annual dividends grew from $350 to $974.
Why this works:
- Automatic compounding
- No effort required
- No taxes until you sell (in taxable accounts, dividends are taxed annually whether reinvested or not, but capital gains compound tax-deferred)
- Dramatically accelerates wealth building
FinanceSwami approach: Always reinvest dividends until retirement. Set up automatic dividend reinvestment (DRIP) at your brokerage. When retired and needing income, turn off reinvestment and take dividends as cash.
Strategy #6: Rebalancing (Maintain Your Target)
Rebalancing means periodically selling assets that have grown too large and buying assets that have shrunk, bringing your portfolio back to your target allocation.
How it works:
You target 70% VOO / 30% QQQM. After a year where VOO surged, your allocation has drifted to 75% VOO / 25% QQQM. You sell 5% VOO and buy 5% QQQM to restore 70/30.
Rebalancing Example:
| Asset | Target | Current | Drift | Action |
| VOO | 70% ($70,000) | 75% ($82,500) | +5% | Sell $12,500 |
| QQQM | 30% ($30,000) | 25% ($27,500) | -5% | Buy $12,500 |
After rebalancing, you’re back to 70/30 ($70,000 VOO / $30,000 QQQM).
Why this works:
- Forces you to “sell high, buy low” (contrarian but correct)
- Maintains your intended risk level
- Adds 0.3-0.7% annually to returns over long periods
- Prevents any single investment from dominating
FinanceSwami approach: Rebalance once per year on December 31st, and only if allocation has drifted 5%+ from target. Otherwise, leave it alone.
Strategy Comparison Table
| Strategy | Effort Required | When to Use | FinanceSwami Recommendation |
| Dollar-Cost Averaging | Setup once | Monthly contributions | ✓ Essential for everyone |
| Buy and Hold | Almost none | All the time | ✓ Core strategy |
| Index Funds | Minimal | Foundation | ✓ 100% of portfolio |
| Tax-Loss Harvesting | Low | During crashes, taxable accounts | ✓ Once per year if applicable |
| Dividend Reinvestment | Setup once | Until retirement | ✓ Essential until age 65+ |
| Rebalancing | Low | Once per year | ✓ December 31st annually |
The winning combination: Dollar-cost average into index funds, buy and hold forever, reinvest dividends, rebalance once per year. That’s it. Simple, boring, effective.
13. What to Do When the Market Crashes
Let me prepare you for what will inevitably happen: the market will crash. It might drop 20%, 30%, or even 40%. It will happen multiple times during your investing lifetime. Your gut reaction will be to sell everything. That reaction will be exactly wrong.
Let me explain what to actually do.
Market Crashes Are Normal and Inevitable
First, understand that crashes are a normal part of investing. They’re not aberrations or signs that “this time is different.” They’re built into the system.
Historical Market Crashes:
| Year | Event | S&P 500 Decline | Recovery Time |
| 1929-1932 | Great Depression | -86% | 25 years |
| 1973-1974 | Oil Crisis | -48% | 8 years |
| 1987 | Black Monday | -34% | 2 years |
| 2000-2002 | Dot-com Bubble | -49% | 7 years |
| 2008-2009 | Financial Crisis | -57% | 6 years |
| 2020 | COVID Crash | -34% | 5 months |
| 2022 | Inflation/Rate Hikes | -25% | 2 years |
Notice the pattern: Every single crash was followed by a recovery. Every single one. The stock market has never failed to recover and reach new highs eventually.
According to research analyzing market data since 1926, the market experiences a decline of 10% or more approximately once per year on average, and a decline of 20% or more approximately once every three years. If you invest for 30 years, you’ll likely experience 8-10 crashes of 20% or more.
This is normal. It’s not a crisis. It’s part of how markets work.
What Happens During a Crash (The Emotional Reality)
Let me walk you through what a crash actually feels like so you’re prepared.
Your portfolio: $100,000
Market drops: -30%
Your portfolio now: $70,000
Week 1: “Okay, the market is down 10%. This is just a correction. It happens. I’ll stay calm.”
Week 2: “Now it’s down 20%. $20,000 gone. This is really uncomfortable. Maybe I should sell before it gets worse?”
Week 3: “Down 30% now. I’ve lost $30,000. Everyone on the news says it’s going to get worse. Maybe I should sell and wait for it to bottom out, then buy back in?”
This is where most people make the catastrophic mistake: they sell.
Why Selling During a Crash Is Disastrous
Scenario 1: You panic-sell
- Portfolio: $100,000 before crash
- Drops to: $70,000 during crash
- You sell at: $70,000 (trying to “stop the bleeding”)
- Market bottoms at: $65,000 (5% lower than where you sold)
- Market recovers: Back to $100,000 over next 2 years
- Your portfolio: Still $70,000 (you’re out of the market, sitting in cash)
- Permanent loss: $30,000
Scenario 2: You stay invested
- Portfolio: $100,000 before crash
- Drops to: $70,000 during crash
- You hold steady (don’t sell)
- Market bottoms at: $65,000 (paper loss of $35,000)
- Market recovers: Back to $100,000 over next 2 years
- Your portfolio: $100,000
- Permanent loss: $0
Same crash. Two completely different outcomes. The investor who stayed invested recovered fully. The investor who sold locked in permanent losses.
According to the Dalbar Quantitative Analysis of Investor Behavior study, the average investor earned only 3.9% annually over a 20-year period while the S&P 500 averaged 9.2% annually—a gap of 5.3% per year caused primarily by panic-selling during downturns.
The Cost of Missing the Recovery
Here’s what kills wealth: the best recovery days often come immediately after the worst crash days. If you sell during a crash, you miss the recovery.
Impact of Missing Best Days (1993-2022):
| Investment Strategy | Result | $10,000 Becomes |
| Stayed invested entire 30 years | 9.8% annual return | $170,000 |
| Missed 10 best days | 6.1% annual return | $61,000 |
| Missed 20 best days | 4.3% annual return | $36,000 |
| Missed 30 best days | 2.8% annual return | $23,000 |
Missing just 10 days out of 7,500 trading days (0.13% of days) cuts your wealth by 64%. The problem: those 10 best days are impossible to predict and often occur right after crashes when everyone is scared.
Six of the 10 best market days in the past 20 years occurred within two weeks of the 10 worst days. If you sell during a crash trying to “wait for things to calm down,” you miss the snapback recovery.
What to Actually Do During a Crash
Here’s your action plan for the next market crash:
Step 1: Do nothing (seriously)
- Don’t sell
- Don’t check your account daily
- Don’t watch financial news
- Don’t try to “wait for the bottom” to buy back in
- Just leave everything alone
Step 2: Remember your time horizon
If you’re investing for retirement in 20-30 years, a 2-year market crash is only 7-10% of your investing timeline. It’s noise. Zoom out.
Step 3: Keep your automatic contributions going
This is critical: do not stop your monthly contributions during crashes. In fact, this is when dollar-cost averaging shines. You’re buying more shares at lower prices.
Dollar-Cost Averaging During Crash Example:
| Month | Contribution | Share Price | Shares Purchased |
| Pre-crash | $500 | $100 | 5.0 |
| Crash month 1 | $500 | $80 | 6.3 |
| Crash month 2 | $500 | $70 | 7.1 |
| Bottom month | $500 | $65 | 7.7 |
| Recovery month 1 | $500 | $75 | 6.7 |
| Recovery month 2 | $500 | $90 | 5.6 |
| Total | $3,000 | Avg: $80 | 38.4 shares |
If the price returns to $100, those 38.4 shares are worth $3,840—a $840 gain (28%) on your $3,000 invested during the crash. You made money by continuing to invest when prices were low.
Step 4: Reframe crashes as sales, not disasters
When your favorite store has a 30% off sale, you don’t panic. You buy more. The stock market is the same. When quality companies go on sale, that’s a buying opportunity for long-term investors.
Step 5: Review your allocation (if needed)
If a crash makes you genuinely unable to sleep and you’re considering selling, your allocation might be too aggressive for your risk tolerance. But make this decision after the crash ends, not during it.
Wait until the market has recovered, then adjust your allocation to something you can stick with through the next crash (more dividend stocks, slightly more bonds). Don’t make changes while panicking.
What About Your Emergency Fund?
This is why the FinanceSwami Ironclad Framework emphasizes building a 12-month emergency fund before investing aggressively.
If you have a proper emergency fund:
- You won’t need to sell investments during a crash
- Job loss doesn’t force you to liquidate at the bottom
- Medical emergency doesn’t panic you into selling
- You can stay invested with confidence
If you don’t have an emergency fund:
- You’re forced to sell when you need cash
- This often happens during crashes (job losses spike during recessions)
- You lock in losses permanently
- This is why emergency fund comes before aggressive investing
Real Example: 2020 COVID Crash
Let me show you exactly what happened in 2020 so you know what to expect next time:
2020 COVID Crash Timeline:
| Date | S&P 500 Level | Change from Peak | What Happened |
| Feb 19, 2020 | 3,386 (peak) | 0% | Market at all-time high |
| March 23, 2020 | 2,237 (bottom) | -34% | Panic selling, lockdowns announced |
| August 18, 2020 | 3,389 | 0% | Full recovery in 5 months |
| Dec 31, 2020 | 3,756 | +11% | New all-time high |
| Dec 31, 2021 | 4,766 | +41% | Significantly higher |
Investors who sold in March 2020: Lost 34%, stayed in cash, missed recovery
Investors who stayed invested: Down 34% temporarily, fully recovered in 5 months, up 41% by end of 2021
Investors who kept contributing during crash: Bought shares at 30% discount, significantly outperformed
Same crash. Completely different outcomes based solely on behavior.
The Crash Response Checklist
Save this checklist for the next crash:
□ Do NOT sell anything
□ Do NOT stop automatic contributions
□ Do NOT check account daily
□ Do NOT watch financial news 24/7
□ Do NOT try to time the bottom
□ DO remember your long-term time horizon
□ DO keep contributing (buying shares at discount)
□ DO remind yourself: this has happened before, markets recovered every time
□ DO check your emergency fund is intact
□ DO feel uncomfortable (that’s normal) but stay disciplined
The winning strategy during crashes: Do absolutely nothing, keep contributing, and wait.
15. Practical Planning Tools and Templates
Let me provide you with practical worksheets and templates you can use to plan and track your investing journey.
Investment Planning Worksheet
Use this worksheet to calculate how much you need to invest monthly to reach your goals:
Your Current Situation:
| Item | Your Number |
| Current age | _______ years |
| Target retirement age | _______ years |
| Years until retirement | _______ years |
| Current investment balance | $_______ |
| Monthly amount you can invest | $_______ |
| Expected annual return | 9-10% (historical average) |
Your Retirement Goal Calculation:
| Item | Your Number |
| Current annual expenses | $_______ |
| Retirement expense target (150% of current) | $_______ × 1.5 = $_______ |
| Expected Social Security annual | $_______ |
| Needed from investments annually | $_______ – $_______ = $_______ |
| Portfolio needed (divide by 0.04) | $_______ ÷ 0.04 = $_______ |
Example:
- Current annual expenses: $40,000
- Retirement target (150%): $60,000
- Expected Social Security: $20,000
- Needed from investments: $40,000
- Portfolio needed: $40,000 ÷ 0.04 = $1,000,000
Monthly Investment Amount Calculator
How much do you need to invest monthly to reach your goal?
Formula: Use online calculator or financial calculator with these inputs:
- Present Value (PV): Current portfolio balance
- Future Value (FV): Target portfolio (from above)
- Number of periods (N): Years until retirement × 12
- Interest rate (I/Y): 10% annual ÷ 12 months = 0.833% per month
- Solve for PMT (monthly payment)
Example Scenarios:
| Current Balance | Target | Years | Monthly Needed | Total Invested | Growth |
| $0 | $1,000,000 | 30 | $1,441 | $519,000 | $481,000 |
| $10,000 | $1,000,000 | 30 | $1,201 | $442,360 | $547,640 |
| $50,000 | $1,000,000 | 30 | $875 | $365,000 | $585,000 |
| $0 | $1,000,000 | 20 | $2,413 | $579,120 | $420,880 |
Your Calculation:
- Current balance: $_______
- Target: $_______
- Years: _______
- Monthly needed: $_______
Emergency Fund Tracker
Track your progress building your 12-month emergency fund:
Monthly Expenses Breakdown:
| Category | Monthly Amount |
| Housing (rent/mortgage) | $_______ |
| Utilities (electric, water, gas, internet) | $_______ |
| Food and groceries | $_______ |
| Transportation (car payment, gas, insurance) | $_______ |
| Insurance (health, life, etc.) | $_______ |
| Minimum debt payments | $_______ |
| Other essential expenses | $_______ |
| Total Monthly Essentials | $_______ |
| 12-Month Target (× 12) | $_______ |
Emergency Fund Progress:
| Month | Amount Saved | Cumulative Total | % of Goal |
| Month 1 | $_______ | $_______ | _____% |
| Month 2 | $_______ | $_______ | _____% |
| Month 3 | $_______ | $_______ | _____% |
| Month 6 | $_______ | $_______ | _____% |
| Month 12 | $_______ | $_______ | _____% |
Investment Account Setup Checklist
Use this checklist to track your account opening and setup:
Phase 1: Emergency Fund
□ Calculated monthly essential expenses
□ Set 12-month target amount
□ Opened high-yield savings account
□ Currently at _____ months saved (target: 12)
Phase 2: Retirement Accounts
□ Enrolled in employer 401(k)
□ Set contribution to get full match (minimum __%)
□ Selected investments in 401(k)
□ Opened Roth IRA at _____________ (brokerage)
□ Linked bank account to Roth IRA
□ Made first investment in Roth IRA
□ Set up automatic monthly transfers ($____/month)
□ Set up automatic investments (70% VOO / 30% QQQM)
Phase 3: Additional Accounts
□ Opened HSA (if available)
□ Opened taxable brokerage account (if maxing retirement accounts)
□ Set December 31 annual review reminder
Portfolio Tracking Template
Track your allocation and rebalancing needs:
Current Portfolio Snapshot (Date: _________)
| Account | Balance | Balance | % of Total | % of Total | |
| Account | Account | Balance | Balance | % of Total | % of Total |
| 401(k) | 401(k) | $_______ | $_______ | _____% | _____% |
| Roth IRA | Roth IRA | $_______ | $_______ | _____% | _____% |
| Taxable Brokerage | Taxable Brokerage | $_______ | $_______ | _____% | _____% |
| HSA | HSA | $_______ | $_______ | _____% | _____% |
| Total Portfolio | Total Portfolio | $_______ | $_______ | 100% | 100% |
Asset Allocation Tracking:
| Asset/Fund | Target % | Current $ | Current % | Difference | Action Needed |
| VOO (S&P 500) | 70% | $_______ | _____% | _____% | _________ |
| QQQM (Nasdaq-100) | 30% | $_______ | _____% | _____% | _________ |
| SCHD, JEPQ, JEPI (Dividend) | 0% | $_______ | _____% | _____% | _________ |
| Bonds | 0% | $_______ | _____% | _____% | _________ |
| Total | 100% | $_______ | 100% |
Rebalancing Decision:
- If any asset is off by 5% or more from target → Rebalance
- If all within 5% of target → No action needed
Monthly Contribution Tracker
Track your contributions and see your progress:
Monthly Contribution Log (Year: _______)
| Month | 401(k) | Roth IRA | Taxable | HSA | Total | Cumulative YTD |
| January | $_____ | $_____ | $_____ | $_____ | $_____ | $_____ |
| February | $_____ | $_____ | $_____ | $_____ | $_____ | $_____ |
| March | $_____ | $_____ | $_____ | $_____ | $_____ | $_____ |
| April | $_____ | $_____ | $_____ | $_____ | $_____ | $_____ |
| May | $_____ | $_____ | $_____ | $_____ | $_____ | $_____ |
| June | $_____ | $_____ | $_____ | $_____ | $_____ | $_____ |
| July | $_____ | $_____ | $_____ | $_____ | $_____ | $_____ |
| August | $_____ | $_____ | $_____ | $_____ | $_____ | $_____ |
| September | $_____ | $_____ | $_____ | $_____ | $_____ | $_____ |
| October | $_____ | $_____ | $_____ | $_____ | $_____ | $_____ |
| November | $_____ | $_____ | $_____ | $_____ | $_____ | $_____ |
| December | $_____ | $_____ | $_____ | $_____ | $_____ | $_____ |
| Annual Total | $_____ | $_____ | $_____ | $_____ | $_____ |
Annual Limits Check:
- 401(k) limit: $23,500 (under 50) / $31,000 (50+)
- Roth IRA limit: $7,000 (under 50) / $8,000 (50+)
- HSA limit: $4,150 (individual) / $8,300 (family)
Age-Based Allocation Planner
Use this template to plan how your allocation should evolve over time:
Your Investment Evolution Plan:
| Your Age | Target Allocation | Notes |
| Current (___) | VOO: ___% / QQQM: ___% / Other: ___% | Current setup |
| Age 35 | 60% VOO / 20% QQQM / 20% SCHD, JEPQ, JEPI | Begin dividend focus |
| Age 40 | 60% VOO / 0% QQQM / 40% SCHD, JEPQ, JEPI | Exit growth stocks |
| Age 45 | 55% VOO / 0% QQQM / 45% SCHD, JEPQ, JEPI +VYM | Increase dividend |
| Age 50 | 45% VOO / 50% SCHD, JEPQ, JEPI +VYM / 5% REITs | Majority dividend |
| Age 55 | 40% VOO / 50% SCHD, JEPQ, JEPI +VYM / 5% REITs / 5% Bonds | Add small bonds |
| Age 60 | 30% VOO / 55% SCHD, JEPQ, JEPI +VYM / 10% REITs / 5% Bonds | Income focus |
| Age 65+ | 15% VOO / 60% SCHD, JEPQ, JEPI +VYM / 10% REITs / 15% Bonds | Maximum income |
Action items for next allocation shift:
- Next shift at age: _______
- Changes needed: _________________________________
- Timeline: Gradually over _____ years using new contributions
Annual Review Template
Use this template on December 31st each year:
Annual Investment Review (Date: December 31, _______)
1. Portfolio Performance:
- Total portfolio value: $_______
- Value one year ago: $_______
- Growth: $_______ (_____%)
- Total contributions this year: $_______
- Investment returns this year: $_______
2. Allocation Check:
□ All assets within 5% of target? (Yes / No)
□ If no, rebalance by: _________________________________
3. Contribution Check:
□ Maximized 401(k) match? (Yes / No)
□ Maximized Roth IRA? ($7,000 / $8,000)
□ Considered increasing 401(k)? (Yes / No)
□ Current savings rate: _____% of income
4. Life Changes:
□ Job change? Income change?
□ Marriage? Children? Divorce?
□ Health changes?
□ Any reason to adjust allocation?
5. Next Year Plans:
- Target monthly contribution: $_______
- Total annual investment target: $_______
- Any allocation changes planned: _________________________________
6. Goals Progress:
- Retirement portfolio target: $_______
- Current portfolio: $_______
- Progress: _____% toward goal
- On track for retirement at age: _______
Retirement Income Planning Worksheet
Plan how your retirement income will work:
Retirement Income Sources (Age 65+):
| Income Source | Monthly Amount | Annual Amount |
| Social Security | $_______ | $_______ |
| Portfolio dividends (5% yield) | $_______ | $_______ |
| Portfolio withdrawals (4% rule) | $_______ | $_______ |
| Pension (if applicable) | $_______ | $_______ |
| Part-time work (if planned) | $_______ | $_______ |
| Total Retirement Income | $_______ | $_______ |
Retirement Expense Budget:
| Expense Category | Monthly Amount | Annual Amount |
| Housing | $_______ | $_______ |
| Healthcare & insurance | $_______ | $_______ |
| Food & groceries | $_______ | $_______ |
| Transportation | $_______ | $_______ |
| Travel & leisure | $_______ | $_______ |
| Utilities | $_______ | $_______ |
| Other expenses | $_______ | $_______ |
| Total Expenses | $_______ | $_______ |
Retirement Cash Flow Analysis:
- Total annual income: $_______
- Total annual expenses: $_______
- Annual surplus/deficit: $_______
- Status: (Surplus / Deficit / Break-even)
First-Year Investment Plan
Use this template to plan your first year of investing:
Month-by-Month Investment Plan (Year 1):
| Month | Action | Amount | Status |
| Month 1 | Open Roth IRA | $1,000 initial | □ Done |
| Buy 70% VOO / 30% QQQM | $700 / $300 | □ Done | |
| Set up automatic transfers | $583/month | □ Done | |
| Month 2-12 | Automatic contribution | $583/month | □ Done |
| Let automation run | Watch it grow | □ Done | |
| End of Year | Review and celebrate | Total invested: $7,996 | □ Done |
Goal for Year 1:
- Total invested in Roth IRA: $7,000 (maxed)
- 401(k) contributions: $_______ (at least to get match)
- Emergency fund progress: $_______ (toward 12-month goal)
- Learn to ignore market volatility: □ Success
Net Worth Tracking Template
Track your overall financial progress beyond just investments:
Net Worth Statement (Date: _______)
Assets:
| Asset Category | Amount |
| Cash (checking/savings) | $_______ |
| Emergency fund | $_______ |
| 401(k) | $_______ |
| Roth IRA | $_______ |
| Taxable investments | $_______ |
| HSA | $_______ |
| Home equity (if applicable) | $_______ |
| Vehicles | $_______ |
| Other assets | $_______ |
| Total Assets | $_______ |
Liabilities:
| Liability Category | Amount |
| Credit card balances | $_______ |
| Student loans | $_______ |
| Auto loans | $_______ |
| Mortgage | $_______ |
| Personal loans | $_______ |
| Other debts | $_______ |
| Total Liabilities | $_______ |
Net Worth Calculation:
- Total assets: $_______
- Total liabilities: $_______
- Net Worth: $_______
Track quarterly or annually to see progress over time.
Investment Milestone Tracker
Celebrate your progress with these milestones:
Investment Milestones Checklist:
□ $1,000 invested – You’ve started! First step complete.
□ $5,000 invested – Building momentum.
□ $10,000 invested – Compound interest getting real.
□ $25,000 invested – Quarter of the way to $100k.
□ $50,000 invested – Major milestone! Phase 2 complete.
□ $100,000 invested – Six figures! Compound interest accelerating.
□ $250,000 invested – Substantial wealth built.
□ $500,000 invested – Half-millionaire status.
□ $1,000,000 invested – Millionaire! Major financial independence.
□ $2,000,000+ invested – Extremely comfortable retirement secured.
Current milestone: $_______
Next milestone: $_______
Projected date to reach: _______
These templates are meant to be used, not just read. Print them out, fill them in, and refer back to them regularly. The simple act of tracking your progress helps maintain discipline and motivation over decades of investing.
Essential Investment Tools and Resources
Having the right tools and resources can help you make decisions confidently and stay on track with your investing journey. Here are the essential tools I recommend for beginners, along with how to use them effectively.
Investment Calculators and Planning Resources
Compound Interest Calculator
Use a compound interest calculator to see how your investments will grow over time based on different contribution amounts and timeframes. Most brokerage websites offer free calculators, or you can use tools like Investor.gov’s compound interest calculator. Input your starting amount, monthly contribution, expected return rate (use 7-10% for stock market investments), and time horizon to see projected growth. This helps you understand whether your current savings rate will get you to your goals, or if you need to increase contributions. These investing ideas about using calculators before you invest can prevent disappointment and help you set realistic expectations.
Quick Investing Comparison Tools
For quick investing comparisons between different strategies, tools like Vanguard’s asset allocation questionnaire or Charles Schwab’s portfolio builder take 5-10 minutes to complete and provide personalized recommendations. While you don’t have to follow their suggestions exactly, these tools and resources give you a reasonable starting point for portfolio construction. They help you compare a conservative 60/40 stock/bond split versus an aggressive 90/10 split based on your age, timeline, and risk tolerance.
Portfolio Tracking Resources
Personal Capital (Free Portfolio Tracker)
Personal Capital offers free portfolio tracking that aggregates all your investment accounts in one dashboard. You can see your total net worth, asset allocation, investment fees, and performance across all accounts. The platform also offers fee analysis showing how much you’re paying in investment expenses, which helps you identify high-fee funds to replace with lower-cost alternatives. When you review your portfolio quarterly using Personal Capital, you can quickly verify that your allocation hasn’t drifted significantly from your target.
Simple Spreadsheet Tracking
A simple Excel or Google Sheets template where you track monthly contributions, portfolio value, and progress toward goals can be more effective than fancy apps. Create columns for date, contribution amount, total portfolio value, and percentage toward your goal. Update monthly after each contribution. This creates accountability and lets you see your progress over time, which maintains motivation during the slow early years. Tools that help you stay on track like this are often the simplest ones – just a spreadsheet and 5 minutes per month.
Staying Consistent with Your Plan
Automatic Investment Reminders
Set up calendar reminders for quarterly portfolio reviews (every 3 months, 15 minutes) and annual rebalancing (once per year, 30 minutes). These reminders help you stay on track without obsessively checking your investments. Most calendar apps let you set recurring reminders with notes about what to check: verify contributions happened, review your portfolio total value, update tracking spreadsheet, and rebalance if needed. This structured approach prevents both the mistake of checking too frequently (daily) and the mistake of ignoring investments for years.
The key with all tools and resources is using them to support your plan rather than replacing your plan. A calculator doesn’t invest for you – it just shows projections. A tracking app doesn’t make you wealthy – consistent contributions do. Use these tools to help you make decisions at the start, then to help you stay on track during execution, but recognize that the tools are supplements to discipline, not substitutes for it.
16. Common Mistakes Beginners Make (And How to Avoid Them)
Let me show you the most expensive mistakes beginners make—and how to avoid them. Each mistake has a real dollar cost over your investing lifetime.
Mistake #1: Waiting to Start (Cost: $300,000-$800,000)
The mistake: Thinking “I’ll start investing when I have more money” or “I’ll start next year when I know more.”
The cost:
| Starting Age | Monthly Investment | Years Invested | Total Invested | Value at 65 | Opportunity Cost |
| 25 | $500 | 40 years | $240,000 | $3,160,000 | Baseline |
| 35 | $500 | 30 years | $180,000 | $1,028,000 | -$2,132,000 |
| 45 | $500 | 20 years | $120,000 | $382,000 | -$2,778,000 |
Starting at 35 instead of 25 costs $2.1 million. Starting at 45 costs $2.8 million. Every year you wait costs tens or hundreds of thousands in future wealth.
How to avoid:
- Start with whatever you have ($100, $500, $1,000)
- Focus on building the habit, not the amount
- Remember: Time in market beats timing the market
- Set up automatic contributions immediately
Mistake #2: Paying High Fees (Cost: $400,000-$700,000)
The mistake: Buying actively managed mutual funds or paying financial advisors 1-2% annually instead of using low-cost index funds.
The cost:
| Fee Level | Initial Investment | Net Return | Value After 30 Years | Fee Cost |
| 0.05% (index) | $100,000 | 9.95% | $1,725,000 | Baseline |
| 1.00% (managed) | $100,000 | 9.00% | $1,327,000 | -$398,000 |
| 2.00% (advisor) | $100,000 | 8.00% | $1,006,000 | -$719,000 |
A 1% fee costs $398,000 over 30 years. A 2% fee costs $719,000. According to research by Vanguard, over a 25-year period, a 1% fee can consume nearly 25% of your total investment value.
How to avoid:
- Use low-cost index funds (VOO 0.03%, SCHD 0.06%)
- Avoid actively managed funds with 1%+ expense ratios
- Don’t pay advisors 1% annually for basic allocation
- Check expense ratios before buying any fund
Mistake #3: Not Getting Employer Match (Cost: $300,000-$400,000)
The mistake: Not contributing enough to 401(k) to get full employer match.
The cost:
Let’s say your employer matches 50% up to 6% of a $75,000 salary. You contribute 3% (only half), so employer only matches on 3% instead of full 6%.
| Contribution Strategy | Annual Amount | With Match | Over 30 Years (7% return) | Opportunity Cost |
| 3% contribution | $2,250 | $3,375 total | $317,000 | Baseline |
| 6% contribution (full match) | $4,500 | $6,750 total | $635,000 | +$318,000 |
Missing half the match costs $318,000 over 30 years. This is free money you’re leaving on the table—essentially giving yourself a pay cut.
How to avoid:
- Always contribute enough to get full employer match
- This is Priority #1 in the FinanceSwami Ironclad Investment Strategy Framework
- If employer matches 6%, contribute at least 6%
- Increase contribution every time you get a raise
Mistake #4: Panic Selling During Crashes (Cost: $100,000-$680,000)
The mistake: Selling investments during market downturns to “stop the bleeding” or “wait for things to calm down.”
The cost:
According to the Dalbar Quantitative Analysis of Investor Behavior study, emotional investing (panic-selling during crashes, buying during peaks) caused the average investor to earn 5.3% less annually than the market over a 20-year period.
| Strategy | Annual Return | $100,000 Over 30 Years | Cost of Panic |
| Buy and hold (market return) | 10.0% | $1,745,000 | Baseline |
| Emotional investor | 4.7% | $398,000 | -$1,347,000 |
Panic-selling during crashes can cost $1.3 million+ over a career. This is the single most expensive behavioral mistake investors make.
How to avoid:
- Build 12-month emergency fund before investing aggressively
- Choose allocation you can stick with during -30% crashes
- Never check portfolio during market turmoil
- Remember: crashes are temporary, selling is permanent
- Keep automatic contributions running during crashes
Mistake #5: Trying to Time the Market (Cost: $500,000+)
The mistake: Waiting for the “right time” to invest, selling before crashes, trying to buy at the bottom.
The cost:
Research shows that missing just the 10 best market days over 30 years cuts returns nearly in half. The problem: those best days are impossible to predict and often occur right after crashes.
| Strategy | 30 Years (1993-2022) | $10,000 Becomes | Opportunity Cost |
| Stayed invested | Captured all days | $170,000 | Baseline |
| Missed 10 best days | 0.13% of days missed | $61,000 | -$109,000 |
| Missed 30 best days | 0.4% of days missed | $23,000 | -$147,000 |
Market timing consistently fails. According to a study by Charles Schwab, a hypothetical “perfect market timer” who invested $2,000 annually at the absolute market low each year from 1993-2022 would have $153,000. A simple dollar-cost averaging investor who invested monthly regardless of market conditions would have $137,000—only 10% less than perfect timing, which is impossible to achieve.
How to avoid:
- Invest immediately when you have money
- Use dollar-cost averaging if nervous about lump sums
- Ignore market predictions and financial media
- Stay invested through all market conditions
Mistake #6: Overcomplicating (Cost: Underperformance + Stress)
The mistake: Building portfolios with 15+ funds, constantly tinkering, trying to optimize everything.
The cost:
Research shows that simple 2-3 fund portfolios often outperform complex 12-15 fund portfolios because:
- Lower fees (fewer funds = lower total expense ratios)
- Less trading (which creates taxes and costs)
- Better adherence (simpler to stick with)
- Easier rebalancing
Comparison:
| Portfolio Complexity | Funds | Average Expense Ratio | Annual Rebalancing Time | Typical Performance |
| Simple | 2-3 | 0.05% | 15 minutes | Matches or beats market |
| Complex | 12-15 | 0.25% | 2-3 hours | Often underperforms |
How to avoid:
- Follow FinanceSwami framework: 2-4 core holdings
- VOO + QQQM when young
- VOO + SCHD + JEPQ + JEPI + VYM when older
- Simple beats complex
Mistake #7: Picking Individual Stocks Without Knowledge (Cost: Highly Variable)
The mistake: Buying individual stocks based on tips, news, or gut feeling without understanding the business.
The cost:
According to research by Brad Barber and Terrance Odean analyzing 66,000 households, individual investors who actively traded stocks underperformed a simple market index by 6.5% annually after costs. Over 20 years, this compounds to massive underperformance.
| Strategy | 20-Year Period | $100,000 Becomes | Difference |
| S&P 500 index | 10% annually | $673,000 | Baseline |
| Average stock picker | 3.5% annually | $199,000 | -$474,000 |
Individual stock picking is a negative-sum game for beginners. For every stock that goes up 10x, dozens go down 50% or more.
How to avoid:
- Build foundation with index funds first
- Only buy individual stocks after learning fundamentals
- Never invest more than 5% in single stock (10% maximum for exceptional companies)
- Focus on index funds for first $50,000-$100,000 invested
Mistake #8: Not Diversifying (Cost: Total Portfolio Loss Possible)
The mistake: Putting too much money in one stock, one sector, or one investment.
The cost:
Examples of concentration disasters:
- Enron employees: Had 401(k) in company stock, lost everything when Enron collapsed
- Tech bubble investors: 100% in tech stocks 2000-2002, lost 80% when bubble burst
- Single stock investors: All money in one company, company fails, lose everything
Real historical example:
| Portfolio | 2000-2002 Dot-com Crash | Recovery Time |
| 100% tech stocks | -83% loss | 15+ years to recover |
| S&P 500 (diversified) | -49% loss | 7 years to recover |
| Diversified 60/40 | -26% loss | 3 years to recover |
How to avoid:
- Follow FinanceSwami diversification guardrails
- Maximum 5% in any single holding
- Maximum 10% for exceptional companies only (Google, Microsoft, JPMorgan)
- Use index funds for instant diversification
Mistake #9: Ignoring Tax-Advantaged Accounts (Cost: $200,000-$500,000)
The mistake: Investing in taxable brokerage accounts before maxing out 401(k) and Roth IRA.
The cost:
| Account Type | $7,000/year × 30 years | Tax Treatment | Net After Taxes |
| Taxable | Grows to $1,217,000 | Pay 15-20% capital gains | ~$1,020,000 |
| Traditional IRA | Grows to $1,217,000 | Pay ordinary income tax | ~$850,000 |
| Roth IRA | Grows to $1,217,000 | Pay $0 taxes | $1,217,000 |
Using taxable accounts instead of Roth IRA costs $197,000 in taxes over 30 years. Roth IRA saves 15-20% on all growth forever.
How to avoid:
- Follow FinanceSwami account priority system
- Max Roth IRA ($7,000/year) before taxable accounts
- Max 401(k) ($23,500/year) before taxable accounts
- Only use taxable after maxing retirement accounts
Mistake #10: Checking Portfolio Too Frequently (Cost: Bad Decisions)
The mistake: Checking portfolio daily or weekly, reacting to short-term movements.
The cost:
According to behavioral finance research, investors who check portfolios frequently are more likely to:
- Panic-sell during downturns (see Mistake #4)
- Make emotional decisions based on recent performance
- Trade more frequently (creating taxes and costs)
- Experience higher stress and anxiety
Study finding: Investors who checked portfolios daily earned 3-5% less annually than those who checked quarterly or annually, primarily due to increased trading and emotional decisions during volatility.
How to avoid:
- Set up automatic contributions and forget about it
- Check portfolio once per year (December 31st)
- Uninstall brokerage app from phone
- Trust the process and stay disciplined
Mistake #11: Not Having Emergency Fund (Cost: Forced Selling)
The mistake: Investing aggressively without building proper emergency fund first.
The cost:
Without emergency fund:
- Job loss forces you to sell investments (often during downturns)
- Medical emergency requires liquidating portfolio
- Major expense (car repair, home repair) means selling stocks
- You’re forced to lock in losses permanently
This is why FinanceSwami Ironclad Framework emphasizes 12-month emergency fund as Step 1 before aggressive investing.
How to avoid:
- Build 12-month emergency fund in high-yield savings
- Keep fund separate from investments
- Don’t invest money you might need within 5 years
- Emergency fund prevents forced selling
Mistake #12: Following Hot Tips and Trends (Cost: $50,000-$200,000)
The mistake: Buying whatever is hot (crypto, meme stocks, whatever CNBC recommends).
The cost:
Examples of trend-chasing disasters:
| Hot Investment | Peak Year | 5-Year Later Result | Investor Experience |
| Dot-com stocks | 2000 | -80% average | Massive losses |
| Gold | 2011 peak | -40% by 2015 | Lost nearly half |
| Bitcoin | 2021 peak at $69k | $30k-$40k (2024) | 40-50% loss for peak buyers |
| Meme stocks (GME) | 2021 peak at $483 | $20-$40 (2024) | 90%+ loss for peak buyers |
Chasing trends typically means buying high (after gains already happened) and selling low (after crash). This is the opposite of wealth building.
How to avoid:
- Ignore financial media and hot tips
- Stick to low-cost index funds
- Remember: By the time something is “hot,” it’s usually too late
- Boring and proven beats exciting and speculative
Mistake #13: Not Increasing Contributions Over Time (Cost: $200,000+)
The mistake: Setting up $500/month contributions and never increasing despite income growth.
The cost:
| Strategy | Starting Contribution | Over 30 Years | Result |
| Static $500/month | $500 | Same forever | $1,028,000 |
| Increase 3% annually | $500 → $1,208 | Grows with income | $1,585,000 |
Not increasing contributions as income grows costs $557,000 over 30 years. As you get raises, promotions, and income growth, investment contributions should grow proportionally.
How to avoid:
- Increase 401(k) contribution 1% every year
- When you get raise, direct 50% of raise to investments
- Set annual review reminder to increase contributions
- Target 15-25% of net income eventually
The Bottom Line on Avoiding Mistakes
The most expensive mistakes are:
- Not starting (-$300k-$800k)
- High fees (-$400k-$700k)
- Panic-selling (-$100k-$1.3M)
- Market timing (-$500k+)
- Missing employer match (-$300k-$400k)
The winning approach:
- Start today with whatever you have
- Use low-cost index funds (VOO, QQQM, SCHD, JEPQ, JEPI)
- Get full employer match always
- Stay invested through all market conditions
- Follow FinanceSwami Ironclad Framework
- Never panic-sell during crashes
These aren’t small errors. They’re career-defining, retirement-altering mistakes. Following a simple, disciplined approach prevents all of them.
17. Tax-Advantaged Investment Accounts Explained
Let me explain how different investment accounts are taxed and why this matters enormously for your wealth.
Why Taxes Matter in Investing
Here’s a fact most beginners don’t realize: Where you invest (which account) matters almost as much as what you invest in.
The same investment—let’s say VOO earning 10% annually—will build dramatically different wealth depending on which account holds it.
Example: $7,000/year invested for 30 years at 10% return:
| Account Type | Gross Value | Taxes Owed | Net After Taxes | Tax Cost |
| Checking account | $0 (didn’t invest) | $0 | $0 | N/A |
| Taxable brokerage | $1,217,000 | ~$197,000 | ~$1,020,000 | $197,000 |
| Traditional IRA | $1,217,000 | ~$365,000 | ~$852,000 | $365,000 |
| Roth IRA | $1,217,000 | $0 | $1,217,000 | $0 saved |
Same contributions. Same investments. Different accounts. Tax difference of $365,000 between Roth IRA and Traditional IRA.
The Three Tax Treatments
There are three ways investments can be taxed:
Treatment #1: Taxable (Pay Taxes Annually)
- You invest after-tax money
- Pay taxes on dividends every year
- Pay capital gains tax when you sell
- No contribution limits
- No age restrictions on withdrawals
Treatment #2: Tax-Deferred (Pay Taxes Later)
- You invest pre-tax money (reduces current taxable income)
- No taxes while money grows
- Pay ordinary income tax on withdrawals in retirement
- Contribution limits apply
- Penalties if withdraw before 59½
Treatment #3: Tax-Free (Never Pay Taxes)
- You invest after-tax money (no immediate deduction)
- No taxes while money grows
- No taxes on withdrawals in retirement
- Contribution limits apply
- Penalties if withdraw earnings before 59½
Taxable Brokerage Accounts (Treatment #1)
How it works:
You invest money you’ve already paid income taxes on. Every year, you pay taxes on:
- Dividends: Taxed at ordinary income rates (non-qualified) or 0-20% (qualified)
- Interest: Taxed at ordinary income rates
- Capital gains: Taxed when you sell (0-20% for long-term, ordinary rates for short-term)
2024 Capital Gains Tax Rates:
| Income (Single) | Long-Term Capital Gains Rate | Short-Term (under 1 year) |
| $0-$47,025 | 0% | Ordinary rate (10-12%) |
| $47,026-$518,900 | 15% | Ordinary rate (22-24%) |
| $518,901+ | 20% | Ordinary rate (32-37%) |
Example of taxable account taxation:
You invest $10,000 in VOO. Ten years later, it’s worth $25,000. You sell.
- Purchase price: $10,000
- Sale price: $25,000
- Capital gain: $15,000
- Tax rate: 15% (assuming middle income)
- Taxes owed: $2,250
- Net after taxes: $22,750
Meanwhile, dividends of ~2% annually ($200-$500/year) were taxed every year along the way.
When to use taxable accounts:
- After maxing all tax-advantaged accounts
- For money you might need before retirement age
- When you want complete flexibility
Tax-efficient investments for taxable accounts:
According to research on tax efficiency, these investments work best in taxable accounts:
- VOO, VTI – Low dividends, mostly capital gains, tax-efficient
- QQQM – Minimal dividends, growth-focused
- Municipal bonds – Interest is tax-free (if needed)
Avoid in taxable accounts:
- High-dividend stocks and ETFs (dividends taxed annually)
- REITs (dividends taxed as ordinary income)
- Bonds (interest taxed as ordinary income)
- Actively traded funds (high turnover creates taxes)
Traditional IRA and 401(k) (Treatment #2: Tax-Deferred)
How it works:
You contribute pre-tax money (before taxes are taken out). The contribution reduces your taxable income for that year. Money grows tax-deferred—no taxes on dividends, interest, or capital gains while invested. You pay ordinary income tax on all withdrawals in retirement.
Tax impact example:
Current year income: $75,000
Traditional IRA contribution: $7,000
Taxable income: $68,000 (saved ~$1,540 in taxes at 22% bracket)
Withdrawal taxation:
At retirement, every dollar withdrawn is taxed as ordinary income:
- Withdraw $50,000 from Traditional IRA
- All $50,000 is ordinary income
- Pay taxes at your retirement tax bracket (10-37%)
Pros of Traditional IRA/401(k):
- Immediate tax deduction (reduces current taxes)
- Money grows tax-deferred
- Usually in lower tax bracket in retirement
- High contribution limits ($23,500 for 401(k))
Cons of Traditional IRA/401(k):
- All withdrawals taxed as ordinary income (22-37% typically)
- Required Minimum Distributions at age 73 (must withdraw)
- Taxes likely higher than capital gains rates
- You’re betting on being in lower bracket in retirement
Traditional IRA/401(k) makes sense if:
- You’re in high tax bracket now (32% or higher)
- Expect to be in much lower bracket in retirement
- Need immediate tax deduction for cash flow
- Your employer only offers Traditional 401(k)
Roth IRA and Roth 401(k) (Treatment #3: Tax-Free Forever)
How it works:
You contribute after-tax money (no immediate deduction). Money grows completely tax-free. All withdrawals in retirement are tax-free—you never pay taxes on the growth, no matter how large it becomes.
The magic of Roth:
Contribute $7,000 after taxes. It grows to $194,000 over 30 years at 10% annually. When you withdraw that $194,000 in retirement:
- Taxes owed: $0
- Net to you: $194,000
Compare to Traditional IRA:
- Same growth to $194,000
- Taxes owed at 25% bracket: $48,500
- Net to you: $145,500
Roth saves you $48,500 in taxes on that single year’s contribution.
Roth IRA vs. Traditional IRA – 30 Year Comparison:
| Factor | Roth IRA | Traditional IRA |
| Contribution | $7,000 after-tax | $7,000 pre-tax |
| Tax benefit today | $0 | ~$1,540 (22% bracket) |
| Growth over 30 years | $1,217,000 | $1,217,000 |
| Taxes in retirement | $0 | ~$365,000 (30% bracket) |
| Net after taxes | $1,217,000 | $852,000 |
| Advantage | +$365,000 | — |
Roth IRA is more valuable by $365,000 on identical contributions.
Why Roth is so powerful:
Tax-free growth forever: Decades of compound growth, zero taxes
No Required Minimum Distributions: Can leave money growing forever
Tax diversification: In retirement, mix tax-free (Roth) and taxable (Traditional) withdrawals
Estate planning: Heirs inherit tax-free (though RMD rules apply to beneficiaries)
Flexibility: Can withdraw contributions (not earnings) anytime penalty-free
Roth income limits (2024):
| Filing Status | Phase-Out Begins | Fully Phased Out |
| Single | $146,000 | $161,000 |
| Married | $230,000 | $240,000 |
If you earn above these limits, use “backdoor Roth” strategy (contribute to Traditional IRA, immediately convert to Roth).
According to the FinanceSwami Ironclad Investment Strategy Framework, maximizing Roth IRA is Priority #4 (after employer match, debt payoff, and emergency fund). The tax-free growth is incredibly valuable over decades.
Tax-Advantaged Account Comparison Table
| Feature | Taxable Brokerage | Traditional IRA/401(k) | Roth IRA/401(k) |
| Contribution limits | None | $23,500 (401k) / $7,000 (IRA) | $23,500 (401k) / $7,000 (IRA) |
| Tax treatment | Pay annually | Tax-deferred | Tax-free forever |
| Immediate tax benefit | None | Yes (deduction) | No |
| Taxes on growth | Yes (annually) | No (deferred) | No (ever) |
| Taxes on withdrawal | Capital gains (0-20%) | Ordinary income (10-37%) | $0 |
| Withdrawal age | Anytime | 59½ (penalty before) | 59½ for earnings |
| Required distributions | No | Yes (age 73) | No |
| Best for | After maxing retirement accounts | High earners now | Most people |
Health Savings Account (HSA) – The Secret Weapon
If you have a high-deductible health plan, the HSA is the most tax-advantaged account available.
Triple tax advantage:
- Contributions are tax-deductible (like Traditional IRA)
- Growth is tax-free (like Roth IRA)
- Withdrawals for medical expenses are tax-free (unique benefit)
No other account offers all three benefits.
HSA Contribution Limits (2024):
| Coverage Type | Contribution Limit | Catch-Up (55+) |
| Individual | $4,150 | $5,150 |
| Family | $8,300 | $9,300 |
The HSA retirement strategy:
Don’t spend your HSA on current medical expenses. Instead:
- Pay medical expenses out-of-pocket
- Save receipts
- Invest HSA funds (treat like IRA)
- Let it grow for decades tax-free
- In retirement, reimburse yourself for decades of saved receipts (tax-free)
- Or use for retirement medical expenses (tax-free)
- After 65, can withdraw for any reason (taxed as ordinary income, like IRA)
Example HSA Power:
Contribute $4,150/year for 30 years, invest in index funds:
- Total contributed: $124,500
- Value at retirement (10% return): $760,000
- Taxes on growth if used for medical: $0
- Most tax-efficient account possible
According to the FinanceSwami Ironclad Investment Strategy Framework, maxing HSA is Priority #6 (after 401(k) match, Roth IRA, and 401(k) max).
Tax-Efficient Asset Location Strategy
Put the right investments in the right accounts to minimize taxes:
Roth IRA (tax-free forever):
Best for highest-growth, highest-income investments:
- High-dividend ETFs (SCHD, VYM, JEPI, JEPQ)
- REITs (dividends taxed as ordinary income in taxable accounts)
- Individual growth stocks
- Any high-return investments
Traditional 401(k)/IRA (tax-deferred):
Best for balanced allocation:
- Index funds (VOO)
- Target-date funds
- Bonds (if using any)
- Whatever your employer offers
Taxable Brokerage (taxed annually):
Best for tax-efficient investments:
- VOO, VTI (low dividends, mostly capital gains)
- QQQM (minimal dividends)
- Municipal bonds (tax-free interest)
- Long-term buy-and-hold investments
Example: Age 45, $500,000 portfolio, target 60% index / 40% dividend:
Allocation across accounts:
| Account | Balance | Holdings | Why |
| 401(k) | $250,000 | 100% S&P 500 Index | Best employer offers |
| Roth IRA | $150,000 | 100% SCHD, JEPQ, JEPI (dividend) | Tax-free dividend income forever |
| Taxable | $100,000 | 100% VOO | Tax-efficient, mostly cap gains |
Combined allocation:
- Index stocks: $350,000 (70%)
- Dividend stocks: $150,000 (30%)
- Close to 60/40 target while optimizing taxes
This tax-efficient placement saves $50,000-$100,000+ over retirement through reduced taxes.
The Bottom Line on Tax-Advantaged Accounts
Tax-advantaged accounts are one of the biggest advantages regular investors have. Use them fully before using taxable accounts.
Priority order (FinanceSwami Ironclad Investment Strategy Framework):
- 401(k) to employer match (free money)
- Roth IRA max ($7,000/year)
- 401(k) max ($23,500/year)
- HSA max (if available)
- Taxable brokerage
Roth IRA is especially powerful:
- Tax-free growth forever
- No Required Minimum Distributions
- Saves hundreds of thousands in taxes over lifetime
- Should be maximized by almost everyone
Between Roth and Traditional, choose Roth if:
- You’re under 50 years old
- You’re in 22-24% tax bracket or lower
- You expect income/taxes to be higher in retirement
- You want flexibility and no RMDs
The tax savings from proper account usage can exceed $500,000 over a career. This is too important to ignore.
18. The Case for Paying Taxes Now (Roth Philosophy)
Let me explain why I believe most people should prioritize Roth accounts over Traditional accounts—essentially choosing to pay taxes now rather than later.
The Traditional Argument (Pay Taxes Later)
The traditional financial planning wisdom goes like this:
“You’re in the 24% tax bracket now. In retirement, you’ll only be in the 12% bracket because you’ll have less income. So contribute to Traditional IRA/401(k) now, get the 24% deduction, and pay only 12% later. You save 12% in taxes.”
On the surface, this math makes sense. If you’re truly in a lower bracket in retirement, Traditional accounts win.
But I think this logic is flawed for most people, for several reasons.
Why the “Lower Bracket in Retirement” Assumption Is Wrong
Reason #1: You’re planning for a comfortable retirement, not a bare-minimum retirement
According to the FinanceSwami Ironclad Retirement Planning Framework, you should plan for 100-150% of your current expenses in retirement, not 70%.
If you’re currently earning $75,000 and spending $60,000, you don’t want to drop to $42,000 in retirement (70% rule). You want at least $60,000-$90,000 to live comfortably and handle rising healthcare costs, inflation, and unexpected expenses.
To generate $60,000-$90,000 annually, you need substantial portfolio withdrawals from Traditional IRAs/401(k)s—which are all taxed as ordinary income. You may not be in a lower bracket at all.
Reason #2: Tax rates will likely be higher in the future
Current U.S. federal income tax rates are historically low. The 2017 Tax Cuts and Jobs Act lowered rates significantly, but many provisions expire in 2025. Tax rates in 10-20-30 years are likely to be higher than today.
Historical top marginal tax rates:
| Period | Top Rate | Context |
| 1950s-1960s | 70-90% | Post-war era |
| 1980s | 50% | Reagan cuts |
| 1990s | 39.6% | Clinton era |
| 2000s | 35% | Bush cuts |
| 2018-2025 | 37% | Trump cuts (temporary) |
| 2026+ | 39.6%+ likely | Scheduled to revert |
Add to this: Growing federal deficits, Social Security funding challenges, Medicare costs, and infrastructure needs. It’s reasonable to expect higher tax rates in 20-30 years.
If you defer taxes through Traditional accounts, you’re betting that rates will be lower when you retire. That’s a risky bet.
Reason #3: You lose control over your taxes
With Traditional IRAs/401(k)s:
- You must start Required Minimum Distributions at age 73
- The government forces you to withdraw (and pay taxes) whether you need money or not
- These withdrawals can push you into higher brackets
- Can make Social Security taxable (up to 85% of benefits become taxable)
- You have no control—must take RMDs or face 50% penalty
With Roth IRAs:
- No Required Minimum Distributions during your lifetime
- Withdraw only what you need
- Control your tax bracket in retirement
- Social Security less likely to be heavily taxed
- Can leave Roth to heirs (they inherit tax-free wealth)
Reason #4: All Traditional distributions are taxed as ordinary income
This is critical: When you withdraw from Traditional IRA/401(k), every dollar is taxed as ordinary income (10-37% brackets), even though most of the growth came from capital appreciation.
In a taxable account, long-term capital gains are taxed at 0-20%—much lower than ordinary income rates.
Example:
You withdraw $100,000 from Traditional IRA:
- Taxable income: $100,000
- Tax bracket: 24%
- Taxes owed: $24,000
- Net to you: $76,000
You withdraw $100,000 from Roth IRA:
- Taxable income: $0
- Taxes owed: $0
- Net to you: $100,000
Roth saves you $24,000 on this single withdrawal.
The Math: Roth vs. Traditional Over 30 Years
Let me show you the actual numbers with realistic assumptions.
Scenario: Age 35, contribute $7,000 annually for 30 years, 10% return
Roth IRA:
- Contribution: $7,000 after-tax (you paid 24% tax, so you earned ~$9,200 gross)
- Total contributed: $210,000 (after-tax)
- Growth over 30 years: $1,217,000
- Taxes on withdrawal: $0
- Net to you: $1,217,000
Traditional IRA:
- Contribution: $7,000 pre-tax (saved $1,680 in taxes annually at 24%)
- Total contributed: $210,000 (pre-tax)
- Growth over 30 years: $1,217,000
- Taxes on withdrawal: $365,000 (assuming 30% average rate in retirement)
- Net to you: $852,000
Roth advantage: $365,000 more
But wait—what about investing the tax savings from Traditional?
This is the sophisticated counterargument: “With Traditional IRA, you save $1,680 in taxes each year. If you invest that tax savings in a taxable account, you might come out ahead.”
Let’s test this:
Traditional IRA + Investing Tax Savings:
- Traditional IRA grows to: $1,217,000 (taxed to $852,000 net)
- Tax savings invested: $1,680/year × 30 years at 8% (lower due to annual tax drag) = $189,000
- After 15% capital gains tax: $163,000
- Total net: $1,015,000
Still $202,000 less than Roth IRA.
Even when accounting for investing the tax savings, Roth still wins by over $200,000 because:
- Traditional distributions are taxed as ordinary income (24-30%) vs. capital gains (15%)
- Taxable account has annual tax drag from dividends
- Behavioral reality: most people spend tax savings, don’t invest them
When Traditional Makes Sense
I’m not saying Traditional accounts are always wrong. There are situations where they make sense:
Choose Traditional if:
High earner expecting much lower retirement income:
- Currently in 32-37% bracket ($200,000+)
- Plan to retire early and live on much less ($50,000/year)
- Will truly be in 12-22% bracket in retirement
- The bracket difference (32% now vs. 12% later) is worth deferring
Near retirement age:
- Age 55+ and retirement is imminent
- Won’t have decades of tax-free compounding
- Need the immediate tax deduction for cash flow
- Will be in lower bracket very soon
Employer match only in Traditional:
- Some employers only match Traditional 401(k)
- Always get the match, even if Traditional
- Can supplement with Roth IRA separately
Current financial hardship:
- Need every dollar now for survival
- Current cash flow is tight
- Can’t afford to pay taxes on contributions
- Traditional provides immediate relief
For everyone else—especially younger investors under age 50—I believe Roth is superior.
The Psychological Case for Roth
Beyond the math, there’s a powerful psychological benefit to Roth:
Tax certainty: You know exactly how much money is yours. $1 million in Roth = $1 million you keep. $1 million in Traditional = maybe $700,000 after taxes (you don’t really know until you withdraw).
No forced withdrawals: You control when and how much to withdraw. Traditional forces RMDs that might push you into higher brackets.
Simplified retirement planning: When calculating retirement income, Roth withdrawals don’t count as taxable income. Easier to plan.
Legacy for heirs: Your children inherit tax-free wealth. With Traditional, they inherit a tax bill.
Peace of mind: You’ve paid your taxes. No uncertainty about future rates or bracket creep.
The FinanceSwami Recommendation
For most investors under age 50, prioritize Roth over Traditional:
- Max out Roth IRA ($7,000/year) before anything else (after employer match)
- Choose Roth 401(k) if your employer offers it
- Only use Traditional 401(k) if that’s all employer offers
- Build a base of tax-free money for retirement
The ideal retirement tax diversification:
By retirement, you want three buckets:
- Taxable accounts (flexibility, lower capital gains rates)
- Traditional 401(k)/IRA (some pre-tax money)
- Roth IRA/401(k) (tax-free withdrawals)
This gives you control. In retirement, you can strategically withdraw from each bucket to minimize taxes:
- Need $60,000? Take $30,000 from Traditional (stay in 12% bracket), $30,000 from Roth (no tax impact)
- Need $100,000 for emergency? Take from Roth (doesn’t count as income, won’t affect Social Security taxation)
The most important point: Pay the taxes you know today rather than the taxes you don’t know tomorrow. Tax rates will likely be higher, you’ll likely need more income than expected, and having tax-free money in retirement provides flexibility and peace of mind.
18. Investing vs. Saving: When to Do Each
Let me explain when you should be saving (keeping money in cash) and when you should be investing (putting money in stocks).
This is one of the most important distinctions beginners need to understand. Getting this wrong means either taking too much risk with money you need soon, or missing growth opportunities with money you won’t need for decades.
The Core Principle: Match Time Horizon to Investment Type
The fundamental rule is simple:
- Money needed within 5 years → Save in cash
- Money not needed for 5+ years → Invest in stocks
- Money needed in 5-10 years → Balanced approach (60% stocks / 40% bonds)
Why 5 years? Because stock markets can stay down for 3-5 years after crashes. If you need the money during a downturn, you’re forced to sell at a loss. If you can wait 5+ years, markets almost always recover to new highs.
When to Save (Keep Money in Cash)
Save in high-yield savings account (earning 4-5%) for:
1. Emergency fund (12 months of expenses)
This is non-negotiable in the FinanceSwami Ironclad Framework. Keep 12 months of essential expenses in cash:
- Why: Job loss, medical emergency, major unexpected expense
- Where: High-yield savings (Ally, Marcus, American Express Savings)
- Amount: $30,000-$60,000 for most people
- Never invest this money in stocks
2. Short-term goals (needed within 1-3 years)
Examples:
- House down payment in 2 years
- Car purchase in 18 months
- Wedding in 6 months
- Tuition payment next year
- Any expense with firm deadline under 3 years
Why cash: You cannot afford any decline. If market drops 20% right before you need the money, you’re stuck.
3. Debt payoff money
If you’re aggressively paying off debt:
- Keep 1-2 months of payment funds in checking
- Don’t invest money earmarked for next month’s debt payment
- After debt is paid, redirect to investing
4. Peace of mind money
Some people need extra cash beyond 12-month emergency fund for psychological comfort. If having $50,000 in savings (instead of $36,000 minimum) helps you sleep better and invest more aggressively with the rest:
- Keep the extra cash
- Better to have slightly too much in savings than to panic-sell investments
When to Invest (Put Money in Stocks)
Invest in stock index funds for:
1. Retirement (10+ years away)
If you’re under 55 and retirement is 10-30+ years away:
- Invest 100% in stocks (per FinanceSwami framework)
- Start with VOO + QQQM
- Add dividend focus as you age
- Time horizon is long enough to weather all crashes
2. Long-term wealth building (5+ years)
Any goal beyond 5 years benefits from stock market growth:
- Child’s college in 10 years (invest, shift to bonds at year 7-8)
- Financial independence in 15 years (invest aggressively)
- Building wealth generally (invest systematically)
3. Money you won’t need
If you’ve maxed emergency fund, have no debt, and are saving extra money beyond your needs:
- Invest it
- No reason to keep extra cash earning 4% when stocks average 10%
- Every dollar in savings beyond emergency fund is a missed growth opportunity
The Gray Zone: 3-7 Year Goals
What about goals 3-7 years away? This is where it gets nuanced.
Conservative approach (minimize risk):
- 0-3 years away: 100% cash
- 3-5 years away: 30% stocks / 70% bonds or cash
- 5-7 years away: 60% stocks / 40% bonds
- 7+ years away: 80-100% stocks
Aggressive approach (maximize growth):
- 0-2 years away: 100% cash
- 2-5 years away: 50% stocks / 50% cash
- 5+ years away: 100% stocks
FinanceSwami approach for medium-term goals:
- Calculate minimum needed amount
- Keep minimum in cash (guaranteed availability)
- Invest amount above minimum in stocks
- Accept that total might fluctuate but minimum is safe
Example: House down payment
Need $60,000 for down payment in 5 years. Current savings: $30,000.
Conservative: Keep all $30,000 in cash, save $500/month in cash for 5 years
Aggressive: Invest all $30,000 in 60/40 stocks/bonds, save $500/month into same allocation
FinanceSwami compromise:
- Keep $40,000 in cash (minimum needed)
- Invest $20,000 in 60/40 stocks/bonds
- Save $333/month to cash (reaches $60,000 in 5 years guaranteed)
- If investments grow, you have extra for closing costs/furniture
- If investments drop, you still have $60,000 minimum
Common Scenarios: Save vs. Invest Decision Tree
Scenario #1: “I have $5,000. What should I do?”
Decision process:
□ Do you have high-interest debt? → Pay off debt
□ Do you have any emergency fund? → Save to $3,000 minimum
□ Does your employer offer 401(k) match? → Get match
□ Is your emergency fund at 6+ months? → Invest in Roth IRA
□ Is your emergency fund at 12 months? → Invest aggressively
Scenario #2: “I have $50,000 cash sitting in checking. Help!”
Decision process:
□ Emergency fund needed (12 months): $36,000 → Move to high-yield savings
□ Remaining: $14,000
□ Any short-term goals under 3 years? → Keep in savings
□ No short-term goals? → Invest in Roth IRA + taxable brokerage
Scenario #3: “I’m saving for a house in 2 years. Should I invest?”
Answer: No. Keep it in cash.
- 2 years is too short for stocks
- Cannot afford any decline
- Keep in high-yield savings earning 4-5%
- Guaranteed availability when needed
Scenario #4: “I’m 25 and saving for retirement. Where should it go?”
Answer: Invest 100% in stocks.
- Retirement is 40 years away
- Time to recover from multiple crashes
- Follow FinanceSwami framework: VOO + QQQM
- Do not keep retirement savings in cash
Scenario #5: “I have extra money every month after expenses. What should I do?”
Priority order:
- Emergency fund to 12 months → Save
- Get 401(k) match → Invest
- Max Roth IRA ($7,000/year) → Invest
- Pay off debt above 7% → Pay debt
- Max 401(k) ($23,500/year) → Invest
- Short-term goals under 3 years → Save
- Everything else → Invest in taxable brokerage
Savings vs. Investment Return Comparison
Let me show you the cost of keeping too much in savings:
$20,000 over 30 years:
| Strategy | Return | Value After 30 Years | Opportunity Cost |
| Checking (0%) | 0% | $20,000 | Baseline |
| Savings (4%) | 4% | $64,868 | +$44,868 |
| Bonds (6%) | 6% | $114,870 | +$94,870 |
| Stocks (10%) | 10% | $348,988 | +$328,988 |
Keeping money in savings instead of stocks costs $284,000 over 30 years.
But the correct answer isn’t “invest everything.” It’s “invest what you won’t need for 5+ years, save what you’ll need sooner.”
How Much Should Be in Savings vs. Investments?
General guideline for someone in accumulation phase:
| Category | Amount | Where |
| Checking | 1-2 months expenses | Checking account |
| Emergency fund | 12 months expenses | High-yield savings |
| Short-term goals | Full amount needed | High-yield savings |
| Everything else | Unlimited | Invested in stocks |
Example for someone earning $75,000/year, spending $50,000/year:
- Checking: $4,000-$8,000 (1-2 months expenses)
- Emergency fund: $50,000 (12 months)
- Down payment goal (3 years): $30,000
- Total cash: $84,000-$88,000
- Everything else: Invested in 401(k), Roth IRA, taxable brokerage
After emergency fund and short-term goals are funded, every additional dollar should be invested.
The Cost of Staying in Cash Too Long
Many people keep too much in savings out of fear. This is expensive.
Common situation:
“I have $100,000 in savings earning 4%. I’m scared to invest because the market might crash.”
The math:
| Strategy | 10 Years Later | Growth | Opportunity Cost |
| Stay in savings (4%) | $148,024 | +$48,024 | Baseline |
| Invest in stocks (10%) | $259,374 | +$159,374 | +$111,350 |
Staying in cash costs $111,350 over 10 years.
And that assumes you invest the full $100,000. If you keep adding money:
$100,000 initial + $1,000/month for 10 years:
| Strategy | Result | Difference |
| Savings (4%) | $321,000 | Baseline |
| Stocks (10%) | $534,000 | +$213,000 |
The fear of volatility costs $213,000.
FinanceSwami perspective: Keep proper emergency fund (12 months) and short-term goal money in cash. Invest everything else immediately. Don’t try to time the market. Don’t wait for a crash. Start today.
The Bottom Line: Save vs. Invest
Save in cash for:
- Emergency fund (12 months of expenses)
- Goals under 3 years away
- Money you absolutely cannot afford to lose
- Peace of mind if it helps you invest the rest aggressively
Invest in stocks for:
- Retirement (10+ years away)
- Any goal 5+ years away
- Long-term wealth building
- Money you won’t need for 5+ years minimum
The sweet spot:
- Emergency fund: $30,000-$60,000 in high-yield savings
- Short-term goals: Fully funded in cash
- Everything else: 100% invested in stocks (per FinanceSwami framework)
Every dollar beyond emergency fund and short-term goals that sits in savings is a missed opportunity. Invest it, stay patient through volatility, and let compound interest build wealth over decades.
19. Frequently Asked Questions
Q: I’m completely overwhelmed. Where do I actually start?
A: Start simple. This week:
- Open a Roth IRA at Fidelity, Vanguard, or Schwab (takes 15 minutes)
- Link your bank account (takes 5 minutes, wait 2-3 days for verification)
- Transfer $500-$1,000 to start
- Buy 70% VOO and 30% QQQM
- Set up automatic $300-$500/month contributions
- Set up automatic investments into same funds
- Check once per year on December 31st
That’s it. You’re now investing. Everything else can be optimized later.
Q: How much money do I need to start?
A: You can start with as little as $1-$100, but I recommend:
- Minimum: $500 to feel real
- Comfortable: $1,000-$3,000 to diversify properly
- Ideal: $5,000-$10,000 for strong foundation
But monthly contributions matter far more than starting amount. Someone who starts with $1,000 and adds $500/month builds way more wealth than someone who starts with $10,000 and never adds more.
Q: Should I pay off debt or invest?
A: Depends on interest rate:
- Credit cards (15-25% interest): Pay off before investing
- Personal loans (8%+ interest): Pay off before investing
- Auto loans (7%+ interest): Pay off before investing
- Student loans (6% or less): Can invest while paying
- Mortgage (5% or less): Definitely invest while paying
Exception: Always get full employer 401(k) match first, even with debt. That’s free money.
Q: What if the market crashes right after I invest?
A: Then you got a discount on your first purchase. Keep contributing monthly—you’ll be buying more shares at lower prices. Markets have recovered from every single crash in history. In 5-10 years, you’ll wish you had invested more during the crash, not less.
Historical fact: Investors who started investing in 2007-2008 (right before the financial crisis) and kept contributing monthly still built substantial wealth by 2024.
Q: Is now a bad time to start investing?
A: No. There is never a “bad time” to start investing for the long term. People asked this same question in:
- 2019: “Market at all-time high!” (went higher)
- 2020: “COVID crash!” (recovered in 5 months, then higher)
- 2021: “Market overvalued!” (went higher)
- 2022: “Inflation, bear market!” (recovered in 2023-2024)
- 2024: “Market at all-time high again!” (likely going higher long-term)
The best time to start was 10 years ago. The second best time is today.
Q: What if I’m 40, 50, or 60 and just starting now?
A: You can still build substantial wealth:
- Age 40: 25 years to 65. Investing $1,500/month = $1.6M at retirement
- Age 50: 15 years to 65. Investing $3,000/month = $1.2M at retirement
- Age 60: 10 years to 75. Investing $2,000/month = $411k, plus can work longer
Use catch-up contributions (age 50+):
- 401(k): Up to $31,000/year
- Roth IRA: Up to $8,000/year
- Total: $39,000/year possible
Late start requires higher savings rate, but it’s absolutely doable.
Q: Should I use a financial advisor or do it myself?
A: For most beginners following FinanceSwami framework, you don’t need an advisor. The steps are:
- Build emergency fund
- Get 401(k) match
- Max Roth IRA
- Buy VOO + QQQM when young, shift to dividend focus when older
- Rebalance once per year
This is simple enough to do yourself and saves you 1% in fees ($300,000-$500,000 over a career).
Consider an advisor if:
- You have complex tax situation (business owner, high net worth)
- You need estate planning (over $5M+ assets)
- You have no discipline and need accountability
- Choose fee-only fiduciary advisor (not commission-based)
For simple accumulation and investing, DIY with index funds is best.
Q: What about cryptocurrency, NFTs, or alternative investments?
A: These are speculative gambles, not investments. They:
- Have no underlying earnings or dividends
- Depend entirely on finding someone willing to pay more
- Are extremely volatile (80%+ crashes common)
- Have short track records (no long-term data)
If you want to speculate with 1-5% of portfolio for fun, fine. But build your foundation with proven index funds first. According to FinanceSwami framework, 85-100% stocks (index funds and dividend stocks), 0-15% bonds, 0% crypto/alternatives.
Q: Should I invest in international stocks?
A: Optional. U.S. stocks already provide international exposure—companies like Apple, Microsoft, Google earn 50%+ of revenue internationally.
If you want explicit international diversification:
- Add 10-20% VXUS (Total International Stock Market)
- Or use VT (Total World Stock Market) as your main holding
But it’s not required. Many successful investors (including Warren Buffett’s recommended portfolio) use 100% U.S. stocks.
Q: What’s the difference between ETF and mutual fund?
A: Both are collections of many stocks. Minor differences:
ETF (Exchange-Traded Fund):
- Trades like stock during market hours
- Can buy/sell anytime
- Examples: VOO, QQQM, SCHD, JEPQ, JEPI
- Slightly more tax-efficient
Mutual Fund:
- Trades once per day after market close
- Examples: VFIAX, FXAIX
- Sometimes has higher minimums
For beginners, use ETFs (VOO, QQQM, SCHD). They’re simpler and available at all brokerages.
Q: Should I invest if I rent or should I buy a house first?
A: Invest regardless of homeownership status. These are separate decisions:
- Emergency fund: Need whether renting or owning
- Retirement: Need whether renting or owning
- House: Buy when you can afford 20% down, plan to stay 5+ years, and monthly payment is affordable
Don’t delay retirement investing waiting to buy a house. Do both:
- Save for house down payment in high-yield savings (3-5 year goal)
- Invest for retirement in Roth IRA and 401(k) simultaneously
Q: What if my employer doesn’t offer 401(k)?
A: No problem. Follow this priority:
- Build emergency fund
- Max Roth IRA ($7,000/year)
- If self-employed, open Solo 401(k) or SEP IRA (much higher limits)
- Invest additional money in taxable brokerage account
You can build wealth without employer 401(k). Roth IRA + taxable brokerage is perfectly fine.
Q: How often should I check my investments?
A: Once per year on December 31st. That’s it.
Checking more frequently leads to:
- Emotional decisions during volatility
- Panic-selling during crashes
- Unnecessary stress
- Lower returns (research shows daily checkers earn 3-5% less annually)
Set up automatic contributions, set December 31 reminder, ignore everything else.
Q: What if I need to withdraw money before retirement?
A: Depends on account type:
Roth IRA:
- Can withdraw contributions (not earnings) anytime penalty-free
- Example: Contributed $20,000, grew to $30,000. Can withdraw $20,000 penalty-free
- Earnings ($10,000) must wait until 59½ or pay 10% penalty
401(k) / Traditional IRA:
- Generally locked until 59½
- Exceptions: First home ($10,000), education, medical expenses, disability
- Otherwise 10% penalty plus ordinary income tax
Taxable brokerage:
- Withdraw anytime (just pay capital gains tax)
- No penalties or restrictions
- This is why emergency fund stays in savings, not investments
Q: What allocation should I use if I’m retiring in 5 years?
A: You’re in transition phase. Shift from accumulation to income:
5 years before retirement (age 60):
- 85% stocks (but shifting to dividend focus: SCHD, JEPQ, JEPI VYM, REITs)
- 15% bonds
- Begin building monthly income stream
At retirement (age 65):
- 85% stocks (70% dividend ETFs, 15% index)
- 15% bonds
- Portfolio generating $50k-$100k annual dividends
- Don’t shift to 30/70 stocks/bonds like traditional advice
According to FinanceSwami framework, maintain high stock allocation but focus on dividend-paying stocks that generate income you can live on without selling shares.
Q: Should I invest in my employer’s stock?
A: Maybe, but be very careful with concentration:
If employer offers stock purchase plan (ESPP):
- Buy at 15% discount
- Immediately sell and diversify
- Capture the discount as profit
- Don’t hold long-term
Never put more than 10% of portfolio in employer stock.
Remember Enron: Employees had 401(k)s full of Enron stock. Company collapsed. They lost jobs AND retirement savings. Don’t let this happen to you.
Q: Do I need a lot of money to get started investing?
A: No, you do not need a lot of money to get started with investing. This is one of the most common misconceptions that prevents people from beginning their investment journey. Most major brokerages – Fidelity, Vanguard, Charles Schwab – have eliminated minimum investment requirements entirely, meaning you can open an account and start investing with as little as $100, $50, or even $1 in some cases. Many brokerages now offer fractional shares, allowing you to buy portions of expensive stocks rather than needing thousands of dollars to purchase full shares. The important thing isn’t starting with a large amount – it’s starting consistently and letting time and compound growth do the heavy work. Someone who starts with $500 at age 25 and contributes $200 monthly will end up far wealthier than someone who waits until age 35 and starts with $5,000 because the first person has ten extra years of compound growth. While you do need money to get started investing, the amount required is much smaller than most people think – focus on beginning with what you have rather than waiting until you have more.
Q: What is the difference between saving and investing?
A: Saving and investing serve different purposes in your financial life, and understanding when to do each is crucial. Saving means putting money in safe, easily accessible accounts like savings accounts, money market funds, or certificates of deposit where your principal is protected but growth is minimal (typically 0.5-5% annually). You save for short-term goals and emergency funds – money you might need within the next 1-5 years should be saved, not invested, because you can’t afford to lose value if the market drops right when you need the money. Investing means putting money into assets like stocks, bonds, or real estate that have growth potential but also risk of losing value in the short term. Historical stock market returns average 10% annually, significantly higher than savings accounts, but with the trade-off that your investment may lose value in any given year. You invest for long-term goals 5+ years away – retirement, children’s education, long-term wealth building – where you have time to recover from market downturns and benefit from compound growth. The strategy isn’t choosing saving OR investing – it’s doing both appropriately: save 3-6 months of expenses in emergency fund, then invest for long-term goals in tax-advantaged accounts. Saving for retirement through investing makes sense when you have decades for growth, while saving for a down payment on a house you plan to buy in 2 years makes sense in a high-yield savings account.
Q: How do I know my risk tolerance and risk capacity?
A: Risk tolerance and risk capacity are related but different concepts, and understanding both helps you invest appropriately. Risk tolerance is psychological – how much volatility and potential loss you can handle emotionally without panicking and selling. If seeing your $10,000 investment drop to $7,000 during a market downturn makes you unable to sleep and tempted to sell, you have lower risk tolerance. If you can watch that same decline without stress and even see it as a buying opportunity, you have higher risk tolerance. Risk capacity is practical – how much loss you can afford based on your timeline and financial situation. If you need money in 2 years for a house down payment or payment on a house, your risk capacity is low regardless of your emotional tolerance, because you don’t have time to recover from a market crash. If you’re 30 years old investing for retirement at 65, you have high risk capacity because you have 35 years to recover from temporary losses. To determine your tolerance, imagine your portfolio dropping 30% in value over six months. Would you panic-sell, feel stressed but hold, or confidently buy more? Be honest – overestimating tolerance leads to panic-selling during downturns, which locks in losses. For capacity, consider your timeline: money needed within 5 years should be in safer investments regardless of tolerance; money not needed for 10+ years can handle higher risk through stock-heavy portfolios. The ideal approach balances both: invest as aggressively as your capacity allows while respecting your tolerance enough that you won’t sabotage your plan by panic-selling during inevitable market declines.
Q: Does investing involve risk that I could lose my money?
A: Yes, investing involves risk, and you need to understand this clearly before putting any money into investments. When you invest in stocks, bonds, or other market-based assets, the value of your investment may lose value in the short term due to market volatility, economic conditions, or company-specific problems. During the 2008 financial crisis, the S&P 500 dropped approximately 50% from peak to trough, meaning a $10,000 investment temporarily fell to $5,000. During the 2020 COVID market crash, stocks dropped 30-35% in a month. These are real declines that affect real money, and they happen periodically as part of normal market cycles. However, the critical distinction is between temporary fluctuations and permanent loss. If you panic-sell during a downturn, you convert temporary paper losses into permanent realized losses. Investors who held through 2008 recovered all losses within 4-5 years and went on to substantial gains. Historically, the stock market has never failed to recover from crashes over sufficiently long time periods – every previous decline, no matter how severe, was followed by recovery and new highs. This is why investing is appropriate for long-term goals (5+ years away) but inappropriate for short-term needs. Yes, investing involves risk, but NOT investing involves the guaranteed risk of inflation eroding your purchasing power. Money in savings loses 2-3% annually to inflation, while diversified stock investments historically gain 7-10% annually after inflation. The risk you should fear isn’t market volatility – it’s the risk of not having enough money in retirement because you kept everything in “safe” savings that lost purchasing power for decades.
Q: What are the steps to start investing right now?
A: Here are the concrete steps to start investing today, assuming you have emergency fund established and no high-interest debt: (1) Choose a brokerage – Fidelity, Vanguard, or Charles Schwab are all excellent for beginners with low fees and good fund options. Visit their websites and click “Open Account.” (2) Decide on account type – For most people starting out, this means opening a Roth IRA if you qualify (income under $161,000 single/$240,000 married for 2026), or a traditional IRA if you don’t. This is the right type of account for long-term retirement investing with tax advantages. (3) Fund your account – Link your checking account and transfer your initial investment amount. Most brokerages process transfers in 2-4 business days. You can open an account with as little as $100-500 to begin investing. (4) Choose your investment – For beginners follow the Ironclad Framework. These are simple investment product options that provide diversification automatically. (5) Set up automatic monthly contributions – Schedule recurring transfers from your checking account and automatic purchases of your chosen fund. This automation removes emotion and ensures consistent investing regardless of market conditions. (6) Turn on dividend reinvestment – Enable DRIP (dividend reinvestment plan) so any dividends automatically buy more shares rather than sitting as cash. These steps to start investing take 30-60 minutes total to complete the first time. Once automation is set up, you contribute monthly without thinking about it and only review your portfolio quarterly to verify everything is working correctly.
20. Conclusion: Don’t Wait for the Perfect Time—Just Start
If you’ve read this far, you understand the fundamentals of investing. You know what investing is, why it matters, how compound interest works, what accounts to use, what to buy, and how to avoid expensive mistakes.
Now comes the most important part: actually starting.
I know it’s tempting to wait. Wait until you have more money. Wait until you understand everything perfectly. Wait until the market settles down. Wait until you feel completely ready.
But waiting is the most expensive decision you can make.
Remember the math we covered earlier: Starting at 35 instead of 25 costs over $2 million. Starting at 45 costs nearly $3 million. Every month you delay is tens of thousands of dollars in future wealth you’ll never recover.
The perfect time to start investing doesn’t exist. There will always be uncertainty. Markets will always feel risky. There will always be reasons to wait—a potential crash, economic concerns, political uncertainty, personal financial stress. None of these reasons are good enough to delay.
The investors who build serious wealth aren’t the ones with perfect timing or the highest IQs or access to secret strategies. They’re the ones who started, stayed consistent, and remained patient through decades of market ups and downs.
Here’s what I want you to do this week:
If you haven’t started yet, take the first step. Open a Roth IRA at Fidelity, Vanguard, or Schwab. It takes 15 minutes. Link your bank account. Transfer $500, $1,000, or whatever you have available. Buy 70% VOO and 30% QQQM. Set up automatic monthly contributions of $300, $500, or $1,000—whatever fits your budget.
That’s it. You’re now an investor.
If you’ve already started but you’re not being systematic, fix your system. Set up automatic monthly contributions if you haven’t. Make sure you’re getting your full employer 401(k) match. Make sure you’re maxing your Roth IRA ($7,000/year). Make sure your allocation matches your age according to the FinanceSwami framework.
The strategy I’ve outlined in this guide isn’t complicated:
Build a 12-month emergency fund first. Get your full employer match. Max your Roth IRA. Invest in low-cost index funds (VOO, QQQM, SCHD). Stay invested through crashes. Rebalance once per year. Shift from growth stocks to dividend stocks as you age. Maintain 85-100% stocks throughout your life.
This simple approach has built millions of dollars for millions of people. It’s boring. It’s proven. It works.
The hardest part of investing isn’t the strategy—it’s the discipline. It’s continuing to invest $500 every month even when the market drops 20%. It’s not selling when everyone around you is panicking. It’s staying patient when friends are bragging about hot stock tips or crypto gains. It’s ignoring financial media that profits from fear and urgency.
But if you can maintain that discipline—if you can stay the course through market cycles, through crashes and recoveries, through decades of boring consistency—you will build substantial wealth.
You’ll reach your 50s and realize you have hundreds of thousands of dollars. You’ll reach your 60s with over a million. You’ll retire comfortably, not because you got lucky or made brilliant trades, but because you started early, invested consistently, and stayed patient.
According to the FinanceSwami Ironclad Retirement Planning Framework, you’re not just building wealth for its own sake. You’re building security. You’re building the ability to retire comfortably on 100-150% of your current expenses, not the inadequate 70% traditional advice suggests. You’re building margin so healthcare costs, family needs, and unexpected expenses won’t derail your later years. You’re building peace of mind.
Investing isn’t about getting rich quick. It’s about getting rich slowly and surely. It’s about making your money work as hard for you as you work for it. It’s about building a life where you have options, where you’re not scared about money, where you can be generous with family and enjoy your retirement years without constant financial stress.
The opportunity is in front of you right now. The tools exist—low-cost brokerages with zero fees and minimums. The strategy exists—proven index funds that have built wealth for decades. The knowledge exists—you just read a comprehensive guide on exactly what to do.
All that’s left is the decision to start.
Don’t wait for the perfect time. Don’t wait until you have more money. Don’t wait until you feel completely confident. Start today with whatever you have, and trust that future you will be grateful that present you took action.
Ten years from now, you’ll look back at this moment. You’ll either think “I’m so glad I started when I did” or “I wish I had started back then.” That decision is being made right now.
Start today.
21. About FinanceSwami & Important Note
FinanceSwami is a personal finance education site designed to explain money topics in clear, practical terms for everyday life.
Important note: This content is for educational purposes only and does not constitute personalized financial advice.
22. Keep Learning with FinanceSwami
If this guide helped you understand investing and gave you the confidence to start building wealth, there’s much more I want to share with you.
I’ve created FinanceSwami to be a complete resource for personal finance education—covering not just investing, but budgeting, debt management, income generation, and retirement planning. Everything is explained with the same patient, clear approach you’ve experienced in this guide.
On the FinanceSwami blog, you’ll find comprehensive guides on topics like the FinanceSwami Ironclad Retirement Planning Framework (which explains why you should plan for 100-150% of current expenses, not the 70% rule), systematic wealth-building through the three-phase framework, dividend investing strategies for generating retirement income, and the complete philosophy behind preferring stocks over bonds for most investors.
I also create video content on my YouTube, where I walk through portfolio construction, demonstrate how to open accounts and buy your first investments, explain the math behind retirement calculations, and cover the age-based allocation shifts that align with long-term wealth building. Sometimes seeing concepts explained visually—like how dividend income compounds over decades or how to evaluate whether you’re on track for retirement—helps them click in ways that reading alone doesn’t.
The investing strategy you’ve learned here is built on core principles that run through everything I teach: Start with a solid emergency fund before taking investment risk. Use low-cost index funds as your foundation. Maintain high stock exposure (85-100%) across all life stages, shifting within stocks from growth to dividend rather than shifting to bonds. Keep portfolios simple with 2-5 core holdings. Focus on building sustainable income streams through quality dividend-paying investments. Plan conservatively (100-150% expense replacement, 35-year retirement horizon) but invest aggressively.
These aren’t mainstream recommendations—traditional advice says to shift heavily to bonds as you age and plan for only 70% expense replacement in retirement. But I believe traditional advice sets people up for financial stress in their later years. The FinanceSwami Ironclad Investment Strategy Framework and approach is designed to help you build enough wealth to retire comfortably, handle rising healthcare costs and inflation, support family when needed, and never worry about running out of money.
Thank you for investing the time to read this guide. Now take the next step. If you haven’t implemented your first investment yet, do it this week. Open that Roth IRA. Buy your first index funds. Set up automatic contributions. If you’re already investing but your strategy doesn’t match your age or goals, make the adjustments. And if you’re on track, set that December 31 reminder for your annual review and stay disciplined.
Investing is how normal people build extraordinary wealth. You have everything you need to start. The strategy is simple. The tools are available. The only thing left is taking action.
Your financial future is being built today, one decision at a time. Make the decision to start.
— FinanceSwami